Lot National composition population, historical features the formation of ethnic groups and a vast territory predetermine significant social contrasts between territories Russian Federation... The birth rate between Russian regions differs 3 times, wages and crime - 10 times, unemployment - 25 times, life expectancy differs by 20 years. At the same time, the leadership of the regions in some groups of social indicators is usually combined with a lag in others, which does not allow making an unambiguous division of regions into leading and lagging regions.
At the same time among Russian regions types and groups can be distinguished, characterized by common social problems and strengths.
Two basic types of regions were identified, conventionally called "modernist" and "traditionalist", the differences between which are of a deep, long-term nature.
Type of modernist regions
The modernist type includes the regions of the European part of Russia, the main part of the regions of the Urals, Siberia and Of the Far East, as well as some regions in the Volga region and in the south of the country. They are characterized by the predominance of Slavic (mainly Russian) ethnic groups. Less often, there are inclusions of other assimilated low-religious ethnic groups, also focused on western image life (,). The bulk of the population in most regions of this type lives in cities.
The population of these regions leads a lifestyle characterized by a high level of real secularization, the dominance of such values as education and career, with the degradation of family institutions. Distinctive social features of "modernist" regions are extremely low, insufficient even for simple replacement of generations, fertility, high divorce rate. At the same time, these regions are usually characterized by a higher level of development of social infrastructure (educational institutions, hospitals, sports and recreation organizations). The society in them is distinguished by a low potential for social conflict; in most cases, the population is characterized by an increased educational level and level of material well-being (high wages, low unemployment).
Some of the "modernist" regions can be distinguished into special groups.
The first is formed by the regions - “economic leaders”. These are Moscow, St. Petersburg, Yamalo-Nenets Autonomous Okrug and Khanty-Mansi Autonomous Okrug - Yugra.
Development productive forces, the economic well-being of the industries prevailing in the regions economic activity ensures a high level of well-being local population, the revenues of regional budgets make it possible to provide high quality social infrastructure. The per capita income of the population of the mentioned regions is 1.5-3 times higher than the national average; they have a relatively low unemployment rate and the lowest infant mortality rates, indicating a high quality level of medical care. Thanks to advances in the social sphere, the regions of this group turned out to be the center of attraction for migrants from other parts of the country, as well as immigrants from other countries, which predetermines a more prosperous demographic situation in comparison with other regions belonging to the “modernist” type.
At the same time, a negative feature of these regions is a high price level and a sharp stratification of the population by income level. In the Yamalo-Nenets Autonomous Okrug and the Khanty-Mansiysk Autonomous Okrug - Yugra, where the country's highest indicators of the level of well-being are observed, leadership in certain areas of social development is not sustainable in the long term and is predetermined by their successful specialization for a given period of time in the most highly profitable spheres of economic activities - oil and gas production.
Moscow's leading positions in a number of indicators of social and economic development are also sustainable. They are defined as traditional for large and not different high level development of the country's productive forces by the advantages of concentration of scientific, educational, financial and managerial potential in the largest cities.
The second group unites depressive territories, which include the Primorsky Territory, Altai region, Transbaikal region, Ivanovo, Kurgan regions, in which the social situation as a whole is noticeably worse than in other "modernist" regions.
According to their geographic location, most of these territories are gaps or "bear corners" - they, as a rule, are removed from the largest urban agglomerations and sales markets, the transport infrastructure within them is poorly developed. The unfavorable social situation in these territories is associated with a weak level of economic development - the industry is not developed or is in decline, local budgets are formed mainly through subsidies from the federal center. In a number of regions, the unfavorable industry structure; industries that are not competitive in the global economy prevail, for example, textile industry in the Ivanovo region.
The lagging behind these regions in terms of the level of the population's well-being is especially great. Thus, in 2005, the share of residents living below the poverty line ranged from 25.5% in the Altai Territory to 43% in the Ivanovo Region, while the national average was 16.5%. Material distress and high unemployment rates exacerbate the problems of alcoholism and crime in these regions, which leads to a decrease in life expectancy. Over time (with a change in the degree of development and regional specialization), individual regions may leave or fall into the list of depressed territories.
Traditionalist region type
Most regions can be classified as traditional North Caucasus, some regions and Siberia with a predominantly non-Slavic population. In contrast to the “modernist” regions, the “traditionalist” ones largely retain the traditional way of life, which presupposes high religiosity, a stable institution of the family, family labor outside industrial enterprises... With some exceptions, regions belonging to the "traditionalist" type are characterized by a higher birth rate than the national average, as well as an increased (30% or more) share of people living in rural areas. At the same time, the level of development of productive forces in most regions of this type much lower than the national average, which causes them to lag significantly behind in terms of material well-being and unemployment, and this, in turn, is the outflow of the population to the "modernist" regions. In addition, the heterogeneous national and confessional composition and the low level of efficiency of the bureaucratic system determine high potential conflicts on ethnic and religious grounds.
All regions of the "traditionalist" type can be divided into groups. The first is a group of territories - national autonomies. It includes small in terms of population national entities, usually with a predominance of non-Slavic population, located on the periphery of economic activity in sparsely populated areas with an underdeveloped economy and infrastructure. These are the Nenets Autonomous Okrug, the Altai Republic, the Tyva Republic, the Chukotka Autonomous Okrug.
Many of the characteristics characteristic of "traditionalist" regions are especially pronounced in them. In 2005, in the regions, the share of the population living below the poverty line exceeded 30%; they were characterized by a particularly strong lag in terms of the level of social infrastructure development. These regions traditionally have the highest infant mortality rates in the country. In addition to this, the most acute problem here is the spread of drunkenness, which is exacerbated by the genetically predetermined instability of most local ethnic groups to alcohol. All this, together with the problem of unemployment, determines the high crime rate.
These reasons determine the low level of physical health of the local population and the lowest life expectancy in the country.
The group of republics of the North Caucasus stands out among the "traditionalist" regions. It includes the Chechen Republic, the Republic of Ingushetia and the Republic of Dagestan, within which the features of the group are especially pronounced, as well as the Kabardino-Balkarian Republic and the Karachay-Cherkess Republic. The ethnic groups that make up the basis of the population of these Caucasian republics are highly oriented towards religious (Islamic) values, the institution of the family is relatively stable, and as a result, the demographic situation remains favorable; alcoholism is poorly spread. The latter circumstance leads to high life expectancy in these regions compared to the national average, especially among men. At the same time, the regions of this group are traditionally characterized by a high potential for social conflicts, a weak level of development of social infrastructure, a strong lag in terms of the material well-being of the population.
The core of the groups - the Chechen Republic, the Republic of Ingushetia and the Republic of Dagestan - can be called regions of social contrasts. For example, the Republic of Ingushetia has the highest life expectancy in Russia, where it exceeds the national average by 10 years for the entire population and by 13 years for men. At the same time, this republic is traditionally characterized by the country's worst infant mortality rates. The Chechen Republic leads in the birth rate and natural increase, but at the same time stands out for the worst unemployment rates in the country (74% in 2005).
Regions such as the Republic of Tatarstan (Tatarstan), the Republic of Bashkortostan, the Republic of Sakha (Yakutia), the Republic of North Ossetia-Alania are in an intermediate position between the "traditionalist" and "modernist" types of regions. This is partly due to the significant number of Slavic ethnic groups (with the exception of the Republic of North Ossetia - Alania, they make up more than a third), another reason is that the indigenous population has largely replaced traditional values with modern ones.
Into a set of macroeconomic indicators for regional economic systems includes indicators characterizing the production and use of GRP, changes in the price level (inflation), the dynamics of changes in employment and the level of investment activity (bank loan rate) and other aspects of the financial and economic activities of the regions.
These indicators in individual areas could include the following.
In the field of production:
... GRP volume;
... GRP per capita;
... GRP growth rates;
... the ratio of growth rates of consumption and investment in fixed assets;
... growth of the region's export potential;
... volume index industrial products(in comparable prices);
... the degree of wear and tear of fixed assets;
... the proportion of unprofitable enterprises. In the financial sector:
... the rate on bank loans;
... the growth rate of investments in fixed assets;
... index of the ratio of GRP and tax revenues to the regional budget;
... price level (ratio of prices of the current and base periods);
... budgetary provision of the region;
... the state of accounts payable and receivable in the region, including taxes.
In the social sphere:
... the level of the living wage;
... the share of wages in the GRP;
... the ratio of the average monthly wage and the living wage;
... arrears in payment of wages, pensions and benefits;
... the share of the population with incomes below the subsistence level in the total population;
... the level of financing of social programs from the regional budget;
... natural decline and migration of the population;
... the proportion of officially registered unemployed and the number of unemployed per one place;
... dynamics of the total population of the region, active and employed population;
... human development index.
Let us consider the most important macroeconomic indicators of the regional reproduction process and their use in the analysis of the development of the regional economy.
Indicators of the level of social development of the region
To analyze the economy of large regions of the country (constituent entities of the Federation), the same macroeconomic indicators are used as for the analysis of the national economy. These include:
GDP and its main components (including final consumption), incomes of the population (taking into account their purchasing power), national wealth concentrated in the region (including consumer property), etc.
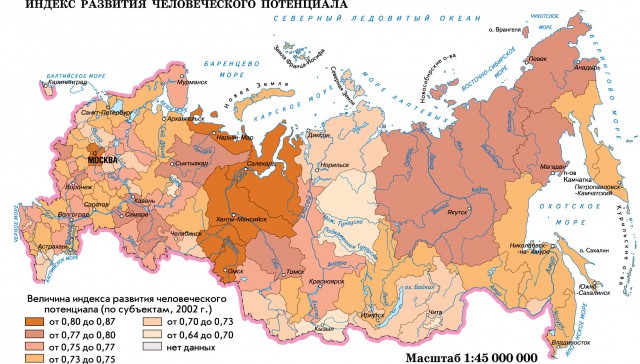
For a generalized assessment of the level of development and quality of life of people, the United Nations Development Program (UNDP) recommends the indicator “human development index”.
The Human Development Index (HDI) provides the most general integral characteristic of the level of well-being of the population of a country and regions.
It includes:
... income, measured by GDP per capita, taking into account different purchasing power in different regions;
... life expectancy, measured by life expectancy at birth;
... knowledge or level of education, measured by the number of literate people and the duration of school education, the number of people with higher specialized education.
It is advisable to associate this indicator with the levels of sustainable welfare, income, consumption, resource use, and capital preservation. Moreover, the dynamics of these indicators and the knowledge of when they are close to the limit of socio-economic sustainability are important.
Various macroeconomic indicators of their stability (instability) are additional and concretizing. The International Bank for Reconstruction and Development offers 26 indicators characterizing the macroeconomic state of the country's economy. The International Monetary Fund uses 10 key macroeconomic indicators for these purposes.
Ownership structure in the region. It is necessary to indicate the share of gross value added produced at privatized enterprises, by branches of the economy: a) industry, b) construction, c) trade, d) catering, e) consumer services, f) other industries.
When considering the ownership structure, it should be borne in mind that the privatization of state-owned enterprises meets the goals of economic reform to the extent that it creates more effective mechanisms of control and responsibility for the performance of enterprises on the part of new owners, since labor collectives are interested in “eating up” capital, because their share of income received through wages is many times higher than the share received through dividends.
Indicators of the production potential of the regional economic complex... Production potential can be characterized by a set of indicators reflecting the state and dynamics of labor, natural and production potential itself.
The labor potential of the region reflects its size, age and sex composition and professional level of training.
The natural potential of the region is characterized by the presence of natural resources: land resources, forests, minerals, water and other types of limited natural resources.
The production potential of a region in the narrow sense of the word can be reflected using indicators characterizing production capacity: the cost estimate of capital resources, material working capital, know-how, etc.
Population and workforce
Population dynamics and demographic processes are closely interconnected with all aspects of social life: economic, social, cultural, household, environmental, and interethnic relations.
When considering these processes, great attention should be paid to the peculiarities of the national mentality of the population living in the region, since without taking into account this factor it is impossible to predict and regulate financial and production activities.
When analyzing the dynamics of the size and national composition of the region's population, it is necessary to indicate the total size and national composition, the rate of change in the size and national composition of the region's population over the last five years and a forecast for the future, reveal the dynamics of the natural population growth in the region and make a forecast for the future.
The main task is to characterize labor resources, employment and labor market in the region.
As part of this work, it is necessary to reflect the dynamics of the number of labor resources for last years, show the distribution of labor resources by type of activity and by sector of the economy over the past five years.
It is necessary to give a characteristic and dynamics of the level of education of the employed population of the region, the percentage of the population engaged in mental (physical) labor, reflect the level of unemployment. In addition, it is advisable to reflect the moral and spiritual development: the level of crime, suicide, mental disorders and other social anomalies.
To characterize wages, it is necessary to reflect the share of wages in total cash incomes by categories of the population, income from property, share in cash income, the amount of real disposable cash income.
In order to characterize the degree of differences in income levels of the region's population, it is necessary to calculate the level of income differentiation (Lorenz curve), the income concentration coefficient (Gini index).
It is necessary to reflect the future state regional policy in the field of labor and employment.
It is important to bring the analysis of the situation in the field of labor to the identification of emerging problems and practical measures of the regional administration to reduce unemployment.
Natural resources of the region
Within this block, the task is to identify the level of self-sufficiency in the main types of natural resources:
... availability of mineral resources (including energy resources);
... the volume of production and the structure of the extracted mineral raw materials.
On this basis, conceptual approaches to the development of the raw material base of minerals should be developed.
The following indicators are used to characterize certain types of natural resources.
a) Land resources. In turn, they include:
... soil quality, distribution of the land fund by natural areas, the structure of land users;
... the quality of agricultural land in the region by types and types of soil;
... distribution of the land fund by categories, lands and users: total, in units of physical volume and in percent.
b) Forest resources. The following indicators are used to characterize them:
... forest cover of the territory, prevailing tree species;
... forest-growing zones: coniferous, coniferous-deciduous, mixed, deciduous;
... stocks of forest stands (in hectares and%) with an indication of the dominant species (young, middle-aged, ripening, ripe, overripe).
In addition, it is necessary to indicate whether there is a gap between logging and reforestation, as well as to reflect the balance of import-export of forest raw materials.
c) Water resources. The following indicators are used to characterize this block:
... the density of the river network, the presence of navigable rivers;
... water use, million cubic meters m (industry, agriculture, population);
... the percentage of wastewater treatment;
... fish stocks and hunting resources, resort and recreational resources;
... commercial stock and catch (catch) opportunities in the region; the most important species of harvested animals and fish;
... the total cadastral value of hunting and fish resources;
... system of specially protected natural areas;
... the total area of reserves, wildlife sanctuaries as a percentage of the total area of the region (with a scientifically based rate of 3%).
Solving the problems of environmental regulation of the socio-economic development of the region requires quantify the impact of industrial and economic activities on the natural environment. The basis for such an assessment can be specific indicators that characterize the ratio of the economic results of production and economic activity and the size of the associated interference with the natural environment, i.e. eco-consistency of production.
The most important factors in the environmental friendliness of production are:
... technical level of production;
... the sectoral structure of industry and agriculture, the amount and structure of fuel consumed;
... range of products.
The location of production in the region should be carried out within the specified environmental restrictions, which can be taken as:
... limits (quotas) of annual volumes of emissions, taking into account their gradual reduction and bringing to a normal level;
... limits (quotas) of the maximum permissible use (withdrawal) of natural resources for individual territories and enterprises, under which the ecological balance is maintained.
Production potential of the region
When characterizing regional reproduction, the production potential of the region is of great importance. According to its economic purpose, the production potential is designed to solve such problems regional development, how:
... meeting the needs of industrial consumption;
... reimbursement of fixed assets worn out in the production process;
... expanded reproduction of fixed and circulating assets and the creation of the necessary stocks of tools and objects of labor, as well as consumer goods;
... formation of consumption funds.
Indicators of the state and development of the economy region a
The analysis of various aspects of the region's economy is carried out in order to identify objective development trends, make a diagnosis, on the basis of which the strategy and tactics of regional development can be built.
Macroeconomic indicators of regional development
The focus is on such indicators of the functioning of the economy as GDP, the unemployment rate, the price level and inflation rate, the state of the state budget and the country's balance of payments, the share of GDP produced by state-owned enterprises, the savings rate, and the discount rate of bank loans.
Indicators of the social status of the region
The indicators reflecting the social status of the economy include, first of all, the indicator of the population size and the volume of labor resources, taking into account the number of people employed in the country's economy (employed in the sphere of public and personal labor and education) and the number of unemployed.
At the regional level, the number of unemployed is the most important indicator of the level of social and economic security of the population. An additional indicator is the tension on regional market labor, characterized by the indicator of the number of unemployed per one vacant position, which is higher than the average level.
There are rather strict interrelationships between individual indicators. Thus, observations show that a 1% decrease in inflation causes an increase in unemployment above the natural level by 1%. In turn, every percentage drop in employment results in a loss of 2.5% of GDP. It is no coincidence that it is unemployment and inflation that are considered the main objects of state regulation in the face of growing instability.
Sectoral structure of production in the region
It is given in the context of the most important interconnected complexes, industries:
The fuel and energy complex includes energy, the development of electrical networks. For these purposes, the energy balance of the region is being drawn up. The latter reflects production and demand for energy resources by type.
Machine-building and defense complexes. To characterize them, the balance of production and import-export of products of the machine-building complex is used. In addition, a list of the largest military-industrial complex enterprises is given with an indication of the type of products manufactured.
The complex of structural materials includes the metallurgical, chemical and woodworking industries.
It also indicates the range of products, the largest enterprises in the industry, the balance of import-export of finished products.
Agro-industrial complex. It is characterized by the following indicators: the volume of agricultural production (by type: crop production, animal husbandry); the volume of production of the industry processing agricultural products (by type); balance of import-export of agricultural products. Agricultural production per capita of the region is indicated.
Complex for the production of consumer goods (other than food)
Light industry. This complex includes forestry, woodworking and pulp and paper industries. According to it, a balance is drawn up for the import-export of finished products, materials, raw materials.
Transport and road facilities in the region; connection. The task of the system of indicators of this complex is to determine the place of the region in the transport complex of the country. For this, indicators are used that characterize the level of security vehicles, as well as by pipeline transport, railways and by roads. Density of railways and highways (km per 1000 sq. Km of territory). In addition, the average annual volume of freight traffic is reflected in the decoding by mode of transport, and the main transport flows of the region are given (traffic diagrams).
Building complex. To characterize it, a description of the largest construction companies in the region is given, the annual volume of construction and installation work is reflected, which characterizes the capabilities of the complex, the percentage of dilapidated housing stock, as well as the volume of orders for construction from businesses and households.
Trade. When analyzing trade as a complex, great attention should be paid to examining the mechanisms of state regulation of processes occurring in the consumer market, reflecting the state of the material and technical base of trade (the number of retail outlets, their area, equipment with refrigerators, freezers, water supply, sewerage, etc.).
III. Social indicators.
They include indicators of health status, quality of life, social activity and demographic indicators.
1) Health indicators:
‣‣‣ life expectancy (expected at birth and actual);
‣‣‣ mortality (general, child, from various causes);
‣‣‣ morbidity (general and from various reasons);
‣‣‣ implementation of measures to prevent diseases;
‣‣‣ provision of medical care;
‣‣‣ the availability of good rest during the holidays;
‣‣‣ the level of injuries at work and at home;
‣‣‣ the scale of smoking, alcoholism, drug addiction.
2) Quality of life indicators:
‣‣‣ availability of places of employment and their compliance with the structure of labor resources;
‣‣‣ the level of income, the gap between high-income and ‣‣‣ low-income categories of citizens;
‣‣‣ access to education and training;
‣‣‣ access to the information;
‣‣‣ provision of housing and recreational facilities;
‣‣‣ the presence of a healthy living environment in places of permanent residence of the population;
‣‣‣ availability of environmentally friendly food products, the scale of their consumption;
‣‣‣ satisfaction of cognitive and cultural needs;
‣‣‣ ensuring the personal safety of citizens.
3) Social activity indicators:
‣‣‣ participation in elections and referenda;
‣‣‣ participation in the activities of public organizations, including environmental ones;
‣‣‣ activities of public environmental expertise (number of projects reviewed);
‣‣‣ cooperation of public, private and government organizations.
4) Demographic indicators:
‣‣‣ population size, incl. urban and rural;
‣‣‣ population density;
‣‣‣ the number of men and women;
‣‣‣ fertility, incl. at different periods of reproductive age in women;
‣‣‣ natural growth population;
‣‣‣ age composition of the population;
‣‣‣ the number of registered marriages and divorces;
‣‣‣ ethnic composition of the population;
‣‣‣ changes in the size and structure of the economically active population;
‣‣‣ population migration, etc.
As indicated above, the issue of indicators of sustainable development still needs to be addressed. The proposed indicators should be considered as a preliminary outline only. It requires changes and additions. At the same time, any list of indicators will change and be refined over time. Each indicator itself can also be broken down into more fractional indicators. Some indicators require a quantifiable search. Finally, indicators require giving them a certain weight (priority) in the indicators of a group.
For many indicators, their spatial distribution is extremely important; therefore, in the process of implementing a sustainable development strategy, geographic information systems (GIS), including inventories, should play an important role. natural phenomena and the spatial characteristics of the economy, population and social sphere.
At the same time, the substantiation of regional indicators of environmental management is of great importance; substantiation of integral indicators of regional sustainable development; application of ecological and economic balances as a form of an integrated territorial cadastre of natural resources; development of methodological principles and approaches for the application at the regional level of the GDP indicator, taking into account the environmental factor (“green” GDP) for the system of accounting and social assessment of natural resources and environmental benefits.
Generalization of foreign and domestic methodological experience in the development of indicators of environmental and economic development establishes the following trends.
1) The growth in the number of indicators used to assess sustainable development makes it necessary to classify them. It is proposed to refer to the ecological and economic indicators the whole set of indicators characterizing the relations in the “society-nature” system. It is recommended to refer to indicators of sustainable development as indicators of balance type, showing the relationship between the “stock of natural capital” and the degree of its consumption, taking into account compensatory measures.
Posted on ref.rf
The following equation can be used as the main condition for sustainable development:
where E ki- a set of economic impacts;
E kj- a set of compensatory measures in ecology.
Accordingly, values greater than 1 will mean deviation from stability, and less than 1 - obtaining a certain margin of stability.
2) For each level of sustainable development indicators - global, national and regional - a leading factor is identified.
Posted on ref.rf
For example, at the regional level, the human (social) factor is playing an increasing role.
3) Integral indicators, which include the GDP adjusted for the environmental factor, the regional “eco-product” and the human development potential index, are used to monitor the transition to sustainable development.
4) At the regional level, the importance of both component indicators (with a general increase in their number) remains, the role of integral indicators, in particular, the assessment of natural resource and human potential, also increases. Within the framework of regional programs of environmental and economic development, component-wise indicators are used, which, using integral environmental and economic accounts, are converted into integral indicators.
In turn, an integrated system of regional ecological and economic indicators during the transition to sustainable development of the region may include:
‣‣‣ economic indicators balanced with the environment;
‣‣‣ indicators of ecological well-being, interconnected according to the scheme "load - state - response measures", united into groups: 1) ecological safety; 2) conservation of biodiversity; 3) load on the environment; 4) the quality of life of the population; 5) environmental policy.
For these purposes, integral environmental and economic indicators can also be used, for example, the index of environmental support for human development and regional eco-product.
UN international organizations have developed a methodology for assessing human development (HDI), which includes life expectancy, education level, literacy and real GDP per capita. Ideally, this indicator is equal to one - when the actual values for the listed parameters coincide with the maximum values.
According to the RPI index, Russia as a whole has a value of 0.804. This indicator should be supplemented with an environmental component, namely, it should also reflect the degree of provision of the population with eco-services (eco-benefits). In our case, eco-services include a part of the natural potential that is actually used by society and is estimated in value form.
According to the research of I. P. Glazyrina, published in the work "Natural capital in the economy in transition" (2001) and the workings of other representatives of the school of ecological economics, natural capital performs the following main ecosystem functions and provides environmental services (Table 1).
Table 1 Selected ecosystem functions and services of natural capital
| P / p No. | Ecosystem Services | Ecosystem functions | Examples of | |
| 2 | ||||
| Regulation | Regulation of co- | CO 2 / O balance 2 levels | ||
| atmospheric composition | atmosphere stave | SOx, ozone content | ||
| Regulation | Global regulation | Greenhouse regulation | ||
| climate | temperature control | gases, cloud formation | ||
| ry and precipitation | ||||
| Support sustained | Resistance | Wind and flood protection | ||
| living states | ecosystems of nature | niy provided by the | ||
| natural environments | fluctuations | property structure | ||
| vegetation | ||||
| Water regulation | Regulation guide | Provision of water | ||
| nie | rological streams | resources for agriculturalists | ||
| cov | military, industrial and | |||
| transport needs | ||||
| live mode | ||||
| Water supply | Storage and retention | River water supply | ||
| podding | mi, lakes, etc. | |||
| Soil formation | Processes | Accumulation of organic | ||
| soil formation | materials | |||
| Erosional con | Conservation of soils | Loss Prevention | ||
| troll, conservation | Noah layer | |||
| soils | ||||
| Cycling provision | Storage, break | Nutritional processes, trophy | ||
| fishing food | botka and provide | iCal chains | ||
| nutritional | ||||
| substances | ||||
| Assimilation from | Recovery | Absorption of waste, babies | ||
| moves | stocked up on nutrients | sication, disposal of contaminants | ||
| substances, etc. | unnatural substances | |||
| Pollination | Pollen transfer | Ensuring reproduction | ||
| plant communities | ||||
| Biological | Di regulation | Predator control chis | ||
| control | namiki trophic | indolence of herbivores | ||
| processes | ||||
| Production | Providing for | Reproduction of fish | ||
| food products | native resources, | herd, game belly | ||
| niya | used as | mushrooms, berries, nuts | ||
| Food | etc. | |||
| Natural raw materials | Providing for | Wood, minerals | ||
| native resources, | payables | |||
| used as | ||||
| raw materials for households | ||||
| war activities | ||||
| Genetic re | Sources of uni | Provision of materials | ||
| resources | kal biological | for the needs of medicine, genetic | ||
| materials and | engineering, decorative | |||
| products | species of plants and animals | |||
| Recreation Providing cultural needs | Providing conditions for recreational activities Providing conditions for non-commercial use of wildlife | Ecotourism, recreation, sport hunting fishing, etc. Aesthetic, artistic, educational, spiritual and scientific values of ecosystems | ||
The ecological component of the human development potential index in our case is equal to:
Ke = Or + Oe + Oz,
where Оr is the volume of health benefits, rubles;
Od is the amount of aesthetic benefits, rubles;
Oz - number of jobs related to security environment and reproduction of natural resource potential (volume of environmental works and services provided), rub.
To obtain the ecological component, both cost data (the cost of recreational man-days) and physical data (oxygen production per hectare of forest) can be used, but in relation to the average Russian values.
To assess the role of regional ecosystems in the sustainable development of the region, an index of sustainable nature management (I) is proposed:
where Pk is the volume of commercial products obtained from the use of ecosystems, rubles;
PE - the actual volume of eco-services produced by them, rubles.
For individual regions and ecosystems, it is necessary to take into account not only the health functions of these ecosystems for the local population, but also their contribution to the improvement of the global ecological situation.
In the future, it is extremely important to obtain zonal (normative) cost volumes of eco-services in the calculation of rubles / 1 ha of various types of ecosystems (forest, steppe, plowed area, etc.), which can be used in assessing future and current losses of natural resource potential in the region, for the development of the payment system (in particular, for the transfer from forest lands to non-forest lands) with the receipt of payments not to resource users, but to special funds for sustainable development.
Ecological economics offers value-based methods for interpreting indicators of sustainable development that are consistent with the current system economic payments and taxes. Its tools are the assessment of the depreciation of natural capital - losses and losses in various forms of environmentally unfavorable social activities... In a specific case - when transferring lands from forest to non-forest, in generalized form - when using the natural resource potential of the region. At the same time, it is important to take a fuller account of the interests of the participants in the environmental management process on the day of assessing local or national economic benefits in the transition to sustainable types of environmental management.
Analysis of the existing experience of developed foreign countries in the area of development of indicators of ecological and economic development shows an increase in regional indicators of the quality of life and the multifunctional use of ecosystems. The expansion of the use of economic assessments testifies to the further introduction of the environmental factor into the practice of decision-making. New approaches to environmental and economic development most of all affect the change in the concept of environmental and economic programming and the associated system of indicators. Administrative bodies at the regional level adhere to the practice of self-determination of sustainable development goals, based on their own financial and institutional capacities.
From this point of view, the justification for the application of the indicator of environmentally adjusted GDP (green GDP) is of great theoretical and practical importance. Despite the existing developments, until now there is no unity of methodological approaches to determine the economic essence of this indicator. Under the "green" GDP (product of eco-development) in a broad sense, it is customary to understand the adjusted social product, which includes the result of changes in all environmental assets, resources and benefits. V general view"Green GDP" can be determined by the formula:
E = GDP-Un,
where E - green GDP, RUB million;
GDP - gross domestic product, million rubles;
Un - accumulated economic damage from environmental pollution, million rubles.
At the same time, as noted by IP Glazyrina, various types of indicators can be used to determine the “green” GDP (Table 2). "
Table 2 Types of indicators for determining green GDP
| Determination of physical quantities | In-kind impact assessment | Cash (monetary) ‣‣‣ appraisals ‣‣‣ |
| Volumes of change in non-renewable resources. The state of renewable natural resources. Changing ecological functions. | Estimates of changes in the environment and natural resources, expressed in such indicators as: ‣‣‣ population health; ‣‣‣ productivity of agriculture; ‣‣‣ quantity and quality of game animals ‣‣‣ global warming ‣‣‣ depletion of the ozone layer, etc. In this case, either direct estimates are usually used (as in the case of productivity), or indirect, for example, using the influence functions | Monetary value of the impact in physical terms. At this level, conceptual and methodological difficulties usually arise associated with the assessment of the `` market '' component of natural capital. |
The indicator of "green GDP", or rather an eco-product, is based on the system of national accounts. By completely copying their scheme, sectors involved in the consumption of the environment and natural resources are singled out from the general economic source of investments and services. Additionally, calculations are introduced that are absent in the traditional GDP - indirect estimates of the degradation (or improvement) of environmental resources - water, air, forests, natural ecosystems.
The use of the indicator of "green-green" GDP can be regarded as an indicator of the country's progress towards sustainable development, which is especially true, for example, in relation to Japan. Having in the early 60s gᴦ. accumulated environmental damage in the amount of 6% of GDP, it succeeded in 1994 ᴦ. reduce this amount to 1.2% of GDP, ᴛ.ᴇ. to ensure the convergence of GDP and "green" GDP. It is customary to understand the regional eco-product as the value of the regional domestic product minus (taking into account) the consumption (restoration) of natural and environmental resources. By analogy with the macroeconomic indicator, but taking into account the regional specifics, a regional "green" product should be developed, which has the form of an ecological and economic balance of the region. Its use is natural in the context of reforming the existing system of relations between users of natural resources and the local administration and requires the creation of fundamentally new decision-making structures, as well as information support when delegating the local administration of property rights to Natural resources... The left side of such a balance - "Environmental assets" characterizes the natural benefits used by society, regardless of whether they have a monetary value or not, and the right side - "Environmental liabilities" - characterizes the obligations that are imposed on the user of natural benefits.
Today in Russia prerequisites are being created for the cost form of environmental accounting in the form of environmental and economic balances of the territory and individual regions. In our opinion, the most important indicator of sustainable development at the national level is the production of gross domestic product (GDP) per capita, taking into account the economic damage from environmental pollution and other types of anthropogenic influences. This indicator is calculated as follows:
![]()
where UR P - sustainable development indicator, rubles / person;
GDP is the volume of gross domestic product͵ rubles;
У - economic damage from environmental pollution and other types of anthropogenic impacts, rubles;
H - population size, people.
By the dynamics of this indicator, one can judge the degree of sustainable development and its pace. Among other key indicators of sustainable development, as already noted, the following should be noted.
Consumption of primary natural raw materials per unit (Ru) rub. determined by the formula:
where C P is the total consumption of primary natural raw materials for the production of GDP, rubles.
Losses of GDP (Yy) are determined as follows:
In this case, it is customary to understand the value of the economic damage from environmental pollution per unit of produced GDP under the loss rate of GDP.
Share of expenditures on environmental protection measures in relation to GDP (Zu):
where 3 P is the total cost of environmental protection measures, rubles.
Among other indicators, the following can be applied to characterize sustainable development:
a) the area of specially protected areas and their growth, as well as their share in the total territory (country, region, etc.);
b) the presence of a healthy living environment in places of permanent residence of the population. This indicator is determined based on the area of the territories natural complex city, district per capita;
c) indicator of population migration, incl. for social and environmental reasons, etc.
As one of the basic indicators of sustainable development, it is possible to use the human development index (introduced by the United Nations Development Program in 1990), which combines indicators of education and living standards in terms of GDP per capita.
Gross savings are traditionally measured in the system of national accounts as the difference between the Gross National Product (GNP) and the Cost of Total Consumption. For the state as a whole, the same rules apply as for the household: if you consume less than you earn, then your well-being increases. On the contrary, if you consume more than you earn, then your well-being decreases and this behavior is unstable in the long run.
Gross Savings = Gross National Product - Total Consumption Value
At the same time, it is extremely important to adjust the traditional method of measuring gross savings in order to determine the net level of savings. Gross savings should be reduced by the amount of depreciation of physical capital. Replacement of equipment, buildings, infrastructure should be carried out at the expense of savings in the annual national accounts.
Net Savings = Gross Savings - Depreciation of Physical Capital
The next step is to determine the real level of savings. To measure the value of real savings, it is extremely important to adjust for the depreciation of natural capital, that is, take into account the decrease in natural resource reserves as a result of exploitation and the decrease in the value of nature due to environmental degradation. There are many practical difficulties in measuring and evaluating such changes in natural capital, but they are surmountable.
Real savings = Net savings - Depreciation of natural capital
Countries have always positive net savings, that is, the potential for physical capital is growing all the time. Real savings calculations show that developed countries pass the test of weak sustainable development. The economies of developed countries are stable because they save more than they wear out physical and natural capital (the issue of measuring the value of human capital is too complicated to be discussed here and now).
Environmental indicators complement the assessment of sustainability. It should be noted that it is not possible to realistically assess whether this development is sustainable directly at this particular moment - ϶ᴛᴏ can be found only on the basis of historical data. The logic of the study of sustainability suggests a different approach. It is possible to assess situations that are unstable, and on this basis to take actions aimed at straightening out the existing situations.
Various international organizations (UN, OECD, World Bank) have initiated the development of environmental indicators. Indicator systems are under development. One suggestion worth exploring is the OECD benchmarking framework. Indicators are divided into typical blocks: impact - state - reaction.
Lecture 3. ʼʼFunctioning of markets. Externalities and optimal contamination levelsʼʼ
III. Social indicators. - concept and types. Classification and features of the category "III. Indicators of the social sphere." 2014, 2015.
The analysis of socio-economic development is the starting point for work on regional development management. Based on the analysis of indicators, the goals of the socio-economic development of the region are determined, program measures and priorities in the development of the regional economic complex are specified. Social economic development the region is the central function of the regional authorities, which becomes especially relevant in times of crisis and constant structural changes. Trends and rates of socio-economic development of both the RF and its subjects depend on a large number of factors (indicators). Decree of the Government of the Russian Federation of 11.10.2001 No. 717 "On the Federal Target Program" Reducing Differences in the Socio-Economic Development of the Regions of the Russian Federation (2002-2010 and until 2015) "" approved the methodology for a comprehensive assessment of the level of social economic development of the constituent entities of the Russian Federation.
Principles: comprehensiveness of the assessment; systematic assessment; the reliability of the initial data; compliance of the indicator system with the tasks of the annual analysis and forecasting of the economic and social development of the regions; maximum information content of the level assessment results; a combination of general economic indicators with indicators reflecting the performance of the state authorities of the constituent entities.
Sources of information: annual statistical reporting State. the statistics committee; materials received from the subjects in the course of monitoring and developing forecasts for the socio-economic development of regions.
1) gross regional product per capita (thousand rubles), defined as the ratio of the gross regional product (GRP) to the population, divided by the coefficient of purchasing power.
2) the volume of investments in fixed assets per capita (thousand rubles), defined as the ratio of the volume of investments from all sources of financing to the population, divided by the coefficient of the rise in the cost of capital expenditures.
3) the indicator of financial security per capita based on indicators of the financial balance (thousand rubles), defined as the ratio of the indicator of financial security of a subject to the population.
4) the ratio of average per capita money income and the size of the subsistence minimum.
5) the share of the population with monetary incomes below the subsistence level in the total population, according to the Federal State Statistics Service;
6) the area of dwellings per inhabitant (square meters) on average, according to the Federal State Statistics Service;
7) provision of places for children in preschool institutions (places for 1,000 children of preschool age);
8) provision of schools - the proportion of students enrolled in the 2nd and 3rd shifts (in percent), according to the Federal State Statistics Service;
9) graduation of specialists by higher and state. secondary educational institutions (specialists per 10 thousand people);
10) provision of the population with doctors and nurses (per 10 thousand people);
11) the provision of the population with outpatient clinics (visits per shift per 10 thousand people), according to the Federal State Statistics Service.
On the basis of these indicators, an integral indicator of the level of socio-economic development of the subject and the effectiveness of the government's activity is calculated.
According to the results of 2012, the increase in the production of GRP of the region is estimated at 10.5% compared to the previous year, which is higher than the same indicator on average in the Northwestern Federal District (3.8%). The volume of GRP per capita in the Arkhangelsk region from 2010 to 2012 increased from 176.9 to 248.5 thousand rubles. At the same time, the average per capita GRP of the region remained below the same indicator for the Okrug - the eighth place among the regions of the Northwestern Federal District and 36th - in Russia.
At the end of 2012, according to the index of industrial production, the Arkhangelsk Region came out on top among the subjects of the Northwestern Federal District, while the growth to the level of the pre-crisis 2008 was 109.6%.
The volume of investments in fixed assets from all sources of financing in the region increased from 57.1 billion rubles in 2010 to 112.1 billion rubles in 2012. During 2010-2012, 61 investment projects were implemented on the territory of the Arkhangelsk Region for a total of 15.1 billion rubles, which made it possible to create 890 new jobs. By 2012, the size of per capita investments in the region exceeded this indicator in the Russian Federation and practically reached the average level in the North-West Federal District.
In January - December 2012, there was an increase in real money income of the population by 2.9% compared to the corresponding period of the previous year (in Russia - by 4.8%, in the Northwestern Federal District - by 3.1%). The share of the population with monetary incomes below the regional subsistence level was 14.1%.
The state of the economy of the Arkhangelsk region in 2012 is characterized by the following main indicators: Industrial production index 2012. by 2011 (in%) - 95.8%, Commissioning of residential buildings at the expense of all sources of financing, thousand m2 of total area - 298.5. Agricultural production, million rubles - 11867.3. Retail trade turnover, million rubles - 162353.2. The volume of paid services to the population, million rubles - 54687.2. Average monthly accrued wages per employee, rubles - 27953.0. Consumer price index (December 2012 in% to December 2011) - 105.9. Cash income (on average per capita), rubles - 23185.0. The number of officially registered unemployed at the end of the period, thousand people 11.0.
Cash income According to preliminary data, in 2012, cash income per person per month amounted to 23185.0 rubles, which is 8.1% more than in 2011, cash expenses, respectively, - 21589.8 rubles and 9.4% ... Real disposable cash income per capita (income minus obligatory payments, adjusted for the consumer price index) increased over this period by 2.8%.
Salary. The average monthly accrued wages of employees of organizations, including small businesses, in January-November 2012 amounted to 27,953.0 rubles and increased in comparison with the corresponding period of 2011 by 14.6%. At the same time, in real terms (taking into account the consumer price index), it increased by 9.7%.
Employment. As of January 1, 2013, 11.0 thousand people, or 1.6% of the economically active population, were officially registered as unemployed in state employment services. Compared to January 1, 2012, the number of unemployed citizens decreased by 1.2 thousand people or by 9.9%.
The workload of the unemployed population registered with the state employment service for one declared vacancy was 1.4 people by the end of December 2012.
According to preliminary estimates, the population of the Arkhangelsk region by the beginning of 2013 will not exceed 1202.5 thousand people, which is 11 thousand people (0.9%) less than on January 1, 2012. The decline in the number was most influenced by the ongoing migration outflow of northerners, whose share in the total loss is 92.9% (10.2 thousand people).
The number of registered marriages and divorces last year in the region, compared to 2011, decreased by 17.8% and 6.4%, respectively. For every thousand newly created married couples in the region, there were 603 divorced (in 2011 - 529).
28.State regional policy: goals, objects, methods and directions.
Regional policy is an integral part of state regulation; a complex of legislative, administrative and economic measures that contribute to the most rational distribution of productive forces and equalization of the living standards of the population. It is an integral part of the state policy aimed at organizing the national space in accordance with the chosen development strategy. The main objects are: administrative-territorial divisions (regions, territories); units of political-territorial division (autonomies formed on a mono- or polyethnic basis); subjects of the federation. In emergency situations, zones of natural and environmental disasters and conflicts become objects. Regional policy covers all the most important branches of material production, employment of the population, placement of the service sector, stimulation of tourism, etc. The main goal of regional policy is to smooth out the most acute social and economic imbalances between individual regions of the country.
Regional policy is a legislatively formalized system of legal, organizational, institutional and financial and economic measures that determine the activities of federal state bodies. authorities, their territorial bodies, state bodies. authorities of the constituent entities of the Russian Federation, LSG bodies, business associations and other institutions of civil society, aimed at achieving goals and solving problems of political, economic and social development of regions in accordance with the main directions of internal and foreign policy the state. The basic goal is to ensure balanced socio-economic development of the constituent entities of the Russian Federation. This presupposes, on the one hand, a reduction in differences in the level of socio-economic development of the constituent entities of the Russian Federation. On the other hand, ensuring a balance between increasing the economic potential of the constituent entities of the Russian Federation and providing a comfortable living environment for the population, creating equal opportunities for citizens of the Russian Federation, regardless of where they live, in exercising their social and economic rights and meeting their needs. OBJECTIVES: rational placement of the federal industrial and social infrastructure, taking into account the competitive advantages of the regions; transition to new principles of application of financial and budgetary instruments of regional policy; introduction of mechanisms that provide additional incentives to improve the efficiency of government agencies. authorities of the constituent entities of the Russian Federation and local government bodies for the development of territories.
Elements: 1) Tax policy - the definition of tax payments and benefits that determine the tax system of the region and the tax regime for business activities. 2) Budgetary - the mechanism for the formation and use of state. financial resources and their redistribution between regions. 3) Price - state. regulation of prices and tariffs, methods and forms of this regulation. 4) Investment - a measure to support the investment activity of economic entities, the distribution of budgetary investments. 5) Structural - a system of measures to support and restructure sectors of the economy. 6) Social policy.
The main directions: - coordination of interaction between the levels of economic management both at the regional level and at the national level; - determination of the effective area of specialization of the region, taking into account the characteristics of the region; - the rise of the economy of depressed areas; - development of new areas, taking into account their resource potential; - pursuing a unified social policy, etc. At present, the role of regional policy in the Russian Federation is constantly growing. Each subject of the federation has its own level of socio-economic development, natural resource potential, and production specialization. Therefore, the direction of regional policy cannot be standard for all regions; it must be coordinated based on specific data.
Methods of conducting regional policy - direct and indirect.
With direct methods of conducting regional policy, the state actively participates in capital investments aimed at improving the territorial structure of the economy (creating growth centers, industrial parks, infrastructure in areas of preference, etc.). With indirect ones, the state, through the financial (tax, customs) system, seeks to create an appropriate economic "climate" in certain regions to stimulate their accelerated development and manage migration flows.
Methods of direct participation are closely related to administrative ones - these are the implementation of state regional programs financed from the state budget, individual structure-forming investment projects; placing orders for the supply of products for national needs (including to support problem regions) through the contract system.
Methods of indirect regulation: creation of special funds for regional development, which should accumulate financial resources to solve various regional problems: implementation of a policy of subventions for enterprises in difficult socio-economic and environmental conditions; attracting private investors for solving problems of regional policy; compensation for additional costs incurred by business entities when locating their enterprises in areas with difficult conditions; granting a tax credit "for the depletion of mineral resources"; setting preferential rates rent when seizing areas for the construction of enterprises that are important for improving the sectoral and territorial structure of the economy; the use of increased prices for environmentally friendly products; imposing sanctions on enterprises that pollute the environment, especially in the most disadvantaged regions.
Concept of the Strategy for the Socio-Economic Development of Regions (2005-2020). PRIORITIES: Formation of a new supporting frame of the country from regions - "locomotives of growth", Formation of regional modules of the National Innovation System, Creation of conditions for industrial modernization, support and development of competitive economic (territorial production) clusters, Creation of a human resource management system. Increasing the mobility of the population, ensuring an effective migration balance in the country. Development of regional employment of the population, Improvement of the quality of state (municipal) management in the regions, primarily increasing the efficiency of the use of public finance.
In April 2014. By Decree of the Government of the Russian Federation of 15.04.2014 N307 "a new version of the state program" Regional policy and federal relations "was approved. and ethnocultural development of the peoples of Russia "; subprogram 3" Assistance in the voluntary resettlement of compatriots living abroad to the Russian Federation "; Federal target program" Strengthening the unity of the Russian nation and ethnocultural development of the peoples of Russia (2014-2020) "; Federal target program" Conservation and restoration of the complex of spiritual, cultural, natural heritage and infrastructure development of the Solovetsky archipelago for 2014 - 2019 ".
The goal of the Program is to ensure the balanced development of the constituent entities of the Russian Federation.
Terms of implementation of the Program - 2013 - 2020
The volume of budgetary appropriations of the Program - the total volume of budgetary appropriations of the federal budget is 149161604 thousand rubles
29. Industrial and social infrastructure of the region .
The regional economy is a complex complex of interconnected industries located on a separate territory and forms a separate system of socio-economic relations. The region's economy is a complex and complex diversified economy, for which, to one degree or another, it is necessary to solve almost all problems of the country's economic development as a whole. Infrastructure is a complex of industries and economic links that serve the production and livelihoods of people. Distinguish between industrial and social infrastructure.
The production infrastructure includes all industries or economically independent links that are not part of production units, organizationally separate from them and serving production itself. The industrial infrastructure includes all types of freight transport and transport facilities in general ( railway stations, sea and river ports, docks, depots, facilities that ensure the smooth operation of oil and gas pipelines, industrial transport, etc.); power lines forming power systems of various sizes; a set of interacting means of transmission and processing of information; objects that ensure the rational use of natural resources and other systems and structures that are not directly used in the production of material goods, but without which normal production cannot be ensured.
Social and domestic infrastructure serving the life of people includes industries, services such as trade, health care, education and culture, all types of passenger transport and communications (engaged in serving the population), urban communication facilities, hotel industry, public catering, the system of recreation and tourism establishments and other subdivisions of the non-production sphere. Social infrastructure, which determines the environment and personal development, is the basis for ensuring the quality of life of the population in the regions.
The economy of the region, regardless of its type, is characterized by internal economic integrity.
The economy of the region has a complex sectoral and territorial structure. Branch structure - a set of branches of the economic complex, characterized by certain proportions and relationships. In the sectoral plan, the structure of a single economic complex is represented by such two spheres as material production (production sphere) and non-material production (non-production sphere). The basis of a single economic complex is the sphere of material production. The production sphere includes: industries that create material benefits for the consumer - industry, agriculture, construction; industries that deliver material goods to the consumer - transport, communications; branches associated with the production process in the sphere of circulation - trade, public catering, material and technical supply, sales, procurement. Non-production sphere - the name of the branches of the economy, the results of which take mainly the form of services: housing and communal services and consumer services for the population; health care, physical education; education; culture; science and scientific services, etc.
The regional economy has specific features:
1. This is, first of all, its some truncation, insufficient complexity of the economy, more pronounced monoculture. This feature is especially evident for small-scale regions, equated to the subjects of the Federation (oblasts, etc.). So, the Arkhangelsk region is characterized by the lack of development of a number of sectors of the economy (light, food).
2. The intermediate position of the regional economy between the federal and local levels of government (the so-called meso-level). This imposes very specific requirements on the organizational and economic mechanism of management: the need to fit into the all-Russian reform strategy and at the same time take into account regional peculiarities, delimit powers not only with the center, but also with local authorities, including the division of property, sources of income for budgets of different levels, etc. . P.
3. Close connection with the natural and geographical factor. Indeed, the availability of resources, their volume, quality of land, natural and climatic conditions, location all play a key role in the economy of the regions. This should also include the degree of development of production potential, the level of economic development of a given territory as a whole. It is known that some regions are highly developed, while others, on the contrary, have a low level of development. Consequently, regional policy cannot fail to take into account the real state of affairs.
4. Communication of the regional economy directly with the population. The authorities and administrations of the region bear significant responsibility for the life support of the population. They come under pressure from below if there is a disruption in life support. Therefore, the social factor plays a primary role in the choice of economic development strategy, in the management of the regional economy.
5. The fundamental property of the regional economy is that the region cannot be doomed to liquidation ("bankruptcy"), to the mechanical termination of its functions to support the population. A feature of its functioning in the event of unfavorable circumstances is the violation of the reproduction process, economic, demographic and natural processes, which is expressed in the depression of the region. Accordingly, economic policy in the regions should provide, as a strategic course, the development of antidepressant measures at all levels of government.
The structure of the economy of the Arkhangelsk region and the social diversification of the population of the region have undergone significant changes in recent years. The increase in the share of raw materials and energy industries in the structure of the regional economy increases the raw material dependence of the Arkhangelsk region on the external economic situation on the markets (timber, oil, gas, etc.). The structure of the economy inherited from the administrative-command system, in comparison with most regions, was the least sensitive to market transformations, had a raw material and military industry. The center viewed the area as raw material base the national economic complex of the country, without placing here processing facilities for deep processing of raw materials. Geographically, industrial production is concentrated mainly in three centers: Arkhangelsk (Arkhangelsk, Severodvinsk, Novodvinsk), Kotlassky (Kotlas, Koryazhma), Onega (Onega with the Onega region). At the same time, more than half of the regional industrial production and the same number of industrial personnel are concentrated in the Arkhangelsk industrial hub. Such a territorial concentration of industry restrains the socio-economic development of other regions, exerts strong anthropogenic pressure on the environment, causing its intense pollution. The huge areas of the region with a multi-level state of the economy and natural and climatic conditions with a low population density and underdeveloped transport infrastructure create additional difficulties in the development of both mini-regions (districts) and the macro-region as a whole - the Arkhangelsk region. Underdeveloped social infrastructure. The set of living goods aimed at facilitating the adaptation and living of people in the North, with a few exceptions, is inferior to the average Russian criteria and often does not correspond to the minimum level of social standards. This applies primarily to paved roads, lack of housing, and especially well-maintained ones. Arkhangelsk region, having a powerful resource potential, does not occupy a position befitting it either in economic development or in the standard of living of the population.
30. Socio-economic problems of strategic development of the region.
The regional organization of the Russian Federation was largely formed in the era of planned industrialization. The processes led to the emergence of a whole range of new economic, social, political and legal problems that directly affected the stability of the socio-economic situation in individual Russian territories and in general the entire regional organization of the country.
Economic structural problems
1. Gradual market optimization of economic activity and population size in the regions, faced with an ineffective spatial organization of the country, led to an increase in the costs of maintaining the infrastructure economy, which is excessive in territories losing population and production assets and insufficient in growing regions (limited opportunities for port facilities, export pipelines in the oil and gas complex, life support systems in housing and communal services). 2. The settlement system inherited from the USSR and the territorial economic organization predetermined the consolidation, first of all, of the country's raw material specialization. The most competitive part of the country on the world market is the raw material zones of Russia. The lack of zones of a highly organized urban life environment (a shortage of modern urban infrastructures, information channels, environmentally friendly living conditions in settlements, limited transport accessibility of the main world centers) becomes an obstacle to the concentration of the resources of the future on the territory of the Russian Federation: highly qualified mobile work force, innovative technologies, sources of information, brands, cultural values and so on.
3. The emerging new hierarchy of regions does not always ensure the growth of connectedness in the country. The existing old regional borders, supported administratively, block the processes of socio-economic development, the leading regions have little effect on the development of other territories.
4. The dominant internal production-territorial organization of most regions in the country does not ensure their competitiveness in the global market. As a result of the Soviet policy of locating productive forces in Russia, there is practically no competitive territorial cluster as a dynamic and internally competitive network of closely localized enterprises that produce the same or related products and jointly provide good market positions for the country, the industry and the enterprises themselves. About one quarter of all constituent entities of the Russian Federation have a single-industry economy and the main donor of their budgets is not production networks, but large vertically integrated corporations.
Social (demographic, qualification and ethnocultural) problems
The existing regional organization of the Russian Federation does not yet fully ensure the reproduction and capitalization of the country's key asset - human resources. Because of this, regional development is faced with a whole range of social (demographic, qualification, ethnocultural) problems.
1. The system of settlement in Russia that has developed as a result of primary industrialization does not provide for the reproduction of human resources in most regions.
2. Maintaining the current birth rate (with constant mortality and the absence of migration growth) may by 2050 lead to an annual population loss of 1.8% and an increase in the proportion of the population of retirement age. The reduction in the number of children and adolescents will lead to the emergence of problems of labor resources capable of reproducing and developing the material and intellectual potential of the Russian Federation. The decline in the population of working age poses a threat to the reduction of the country's economic potential. In the context of expected economic growth, the decline in the economically active population will cause a labor shortage.
3. The country has extremely few attractive regions for the migration inflow of the population.
4. Low mobility of the population within the country is also gradually turning into an extremely acute problem of the regional development of Russia. For a number of regions, a shortage of labor resources is becoming one of the main barriers to economic growth.
5. Low spatial mobility is superimposed on low skill mobility of the population.
6. The existing regional organization of the country does not yet fully ensure the reproduction and capitalization of the key asset - human resources. This is reflected in the destabilization of the quality of life of the population of a part of the Russian regions, their strong stratification according to this indicator, both between the constituent entities of the Russian Federation and within them. This social stratification of Russian society does not allow, firstly, to include the population in the co-financing of social reforms in the field of health care, education and housing and communal services, without which the future of reforms remains very problematic. Secondly, counting on a certain growth in the consumption market, given the current volumes of which rapid economic growth is impossible, and accordingly, the problem of doubling GDP in a given time frame is problematic. Third, social stratification does not allow counting on a change in the structure of the formation of the revenue side of budgets of various levels (in the sense of increasing the share of participation of the population). Fourth, it blocks the emergence of stable institutions of civil society in the territories in the near future.
7. In Russia, there was an insufficient productivity of interethnic and interfaith, cross-cultural interactions, which provided the cultural diversity necessary for development.
Almost all negative development trends characteristic of Russia have an impact on the development of the Arkhangelsk region. The regional specificity and unfavorable natural and climatic conditions also affect the situation in the region. The main problems of socio-economic development of the region: the existing level of transport infrastructure does not allow the efficient use of all types of transport; an increase in production costs of enterprises in the real sector of the economy and a deterioration in their financial condition caused by the outrunning growth in prices and tariffs for energy resources, products and services of natural monopolies and extractive industries; low rates of modernization to renewal of production; housing construction has not received proper development (there is a significant increase in the housing stock of the region, the share of dilapidated and dilapidated housing); demographic problems - natural and migration decline, high mortality at working age lead to an increase in the demographic burden; the low standard of living of the population with significant social and economic differentiation (in the Arkhangelsk region, one fifth of the population lives below the poverty line); the problem of employment and qualified personnel (there is a discrepancy between the needs for personnel in the real sector of the economy and the supply in the labor market); environmental problems.
The Arctic is a multidimensional physical-geographical, water-territorial, socio-economic, ethnic, cultural, geopolitical space adjacent to
North Pole and includes the outskirts of the continents of Eurasia and North America, almost the entire Arctic Ocean with islands, as well as the adjacent parts of the Atlantic and Pacific oceans, five subarctic states. The Arctic zone produces products that ensure the receipt of more than ten percent of the national income of Russia (with a share of the population equal to one percent) and constituting more than twenty percent of the total Russian export. The production of natural gas, apatite concentrate, many strategically important non-ferrous and precious metals (nickel, copper, cobalt and others) is concentrated here. The Arctic macroregion of Russia unites the regions of the Arctic and the Far North of Russia, the main areas of specialization of which will be the extraction of raw materials (including in the polar latitudes and on the shelf of the Arctic seas), the intensification of the development of the timber industry complex and the performance of the functions of the global transport and transit zone. The Arctic macroregion should be one of the pivotal regions of Russia's international cooperation through projects to improve the management scheme of the unified transport system of the North of Russia, including the Northern Sea Route, communication with the Baikal-Amur Mainline, river arteries of Siberia and air transport, the formation of a backbone network of highways, as well as the creation of new and development of existing trunk pipelines, specialized sea terminals to ensure the transportation of raw materials to the processing and marketing areas. At the same time, projects for the development of transport and logistics infrastructure will play an important role.
The aim of the educational research work is to study the differences in the socio - economic development of the regions of the Russian Federation: the concept of socio - economic development, the factors that determine the socio - economic development, the characteristics of the socio - economic development of the regions of the Russian Federation; analysis of differences in the socio - economic development of regions of the Russian Federation, identification of problems in the socio - economic development of regions of Russia and ways to solve them.
The object of research in educational research work is the regions of the Russian Federation.
The subject of the research is the indicators that determine the socio - economic development of the regions of the Russian Federation.
The first (theoretical) part describes the term socio - economic development; factors influencing the socio - economic development of regions. The second (practical) part analyzes the indicators of socio - economic development. The third part identifies the positive and negative aspects of the socio - economic development of the regions of the Russian Federation, leading to a number of problems, and selects the directions for solving these problems.
The educational research work consists of an introduction, three chapters and a conclusion.
Introduction
Theoretical foundations of the study of socio - economic development of regions
1 The concept of socio - economic development of the region. Main indicators of socio - economic development
2 Basic theories and trends in regional development
Analysis of the differences in the socio - economic development of the regions of the Russian Federation
1 Analysis of the main indicators of socio - economic development of the country as a whole
2 Analysis of the dynamics of the main indicators of socio - economic indicators by regions of the Russian Federation
Promising areas of social and economic development of the regions of the Russian Federation
Conclusion
List of sources and literature used
social economic indicator region
Introduction
The regions of the Russian Federation differ markedly in terms of the structure of the economy, natural resource potential, population dynamics and other factors. Accordingly, the rates of socio-economic development of Russian regions during the period of market transformations were different, although they experienced the same external impact. Federal policy has a significant impact on the level and dynamics of development of Russian regions. Increasing their differences depending on their characteristics.
During the period of market reforms, there is a constant change in the growth rates of Russian regions. Some constituent entities of the Russian Federation, which had minimal rates of decline in the early 90s, in subsequent years developed more slowly than those that survived a deep crisis. Thus, in different periods of reforms, the influence of economic factors changes.
Therefore, it is necessary to determine the factors that had a positive or negative impact on regional development, as well as to identify the degree of significance of these factors on the growth rates of the regional economy in different periods of time, and economic ties with the characteristics of the territory, which makes this study relevant.
The aim of this work is to study the rates of economic development of the regions of the Russian Federation.
In accordance with the purpose of the study, the following tasks were set and solved in the work:
.Analyze the dynamics of the main indicators of the socio - economic development of the regions of the Russian Federation; .To identify the factors that determine the direction of the socio - economic development of the constituent entities of the Russian Federation; .Identify the lagging regions and regions - leaders; .Identify promising areas of socio-economic development of the regions of the Russian Federation. The object of research in educational research work is the constituent entities of the Russian Federation. The subject of the research is indicators of socio - economic development. For a full study of the differences in the socio - economic development of the regions of the Russian Federation, it is first necessary to study the theoretical aspects, which is presented in the first part, then to analyze the indicators affecting the socio - economic development of the regions of the Russian Federation, to consider the trends, problems of the socio - economic development of the regions of the Russian Federation. The information base for writing educational research work was the works of domestic and foreign authors devoted to the issues of social and economic development of the regions of the Russian Federation, periodicals, materials of the State Statistics Committee, the Ministry of Economic Development of the Russian Federation, the Internet. 1. Theoretical foundations of the study of socio - economic development of regions 1 The concept of socio - economic development of the region. Main indicators of socio - economic development In order to fully explore the differences in the socio - economic development of regions, you need to have an idea of what socio - economic development is. Socio-economic development (ESD) - expanded reproduction and gradual qualitative and structural positive changes in the economy, productive forces, factors of growth and development, education, science, culture, the level and quality of life of the population, human capital. It is characterized by self-reproduction of social systems and a progressive orientation. According to the goals of regional development, a system of criteria (characteristics of development) and indicators that measure these criteria are being built. Despite some differences between countries and regions in the hierarchy of values and for development purposes, international organizations assess the degree of development of countries and regions according to some universal integral indicators. One of these indicators is the Human Development Index, developed within the framework of the United Nations Development Program. This indicator ranks countries in ascending order from 0 to 1. At the same time, three indicators of economic development are used for the calculation: 1.Life expectancy at birth 2.Intellectual potential (adult literacy and average length of study) .The amount of per capita income, taking into account the purchasing power of the currency and the decrease in the marginal utility of income. In an interregional comparison, just like in an international analysis, the human development index and other similar indicators can be used. Along with the integral indicators, you can also use individual partial indicators of the development of the region. Among them: 1.National income per capita 2.The level of consumption of certain material goods .Accrued wages .Life span .Physical health .The level of education .The degree of happiness of the population Economic development criteria do not always play the role of goals or targets, and vice versa. Quite often, the tactical goals of regional development are intermediate tasks that play the role of necessary conditions for successful development. Among these tactical goals for the development of a region or city are: 1.Attracting new types of business 2.Expansion of an existing business .Small business development .City center development .Industry development .Development of the service sector .Increase in the level of employment of the population of the region. Of particular importance in determining the level of economic development of a region are traditional indicators that assess the level of production and consumption of goods and the growth of this level per capita (gross national income (GNP), gross domestic product (GDP), real GNP per capita, growth rates these indicators). To assess the dynamics of development, it is advisable to use indicators that assess the rate of economic growth in the region: the rate of growth of per capita income, labor productivity, as well as the rate of structural transformation of production and society. The impact on the rate of economic growth is a vital issue for the economic policy of the country as a whole and of a particular region. Purely economic indicators such as GDP, per capita income, labor productivity and their growth rates cannot fully assess the socio-economic development of the region. No less important are indicators of life expectancy, the level of health of the population, the degree of its education and qualifications, as well as indicators of structural changes in production and society. The economic development of many countries and regions is accompanied by a change in the structure of social production, in particular, an industrial society is gradually being replaced by a post-industrial one. More and more of the employed work in the non-material sector, and a smaller part - directly in industry and agriculture. The so-called base industries cease to be so and will never be base again. Consumption is individualized, the circulation of production is falling, the so-called demassification of production takes place. Its intellectualization is deepening, information resources are becoming the main factors of production. The added value is created mainly in intangible sphere, at the same time, work acquires new features: creative functions begin to prevail in it, the prevailing type of worker is a creative person who is committed to his work and strives to introduce new elements into his work. The distinction between low- and high-tech industries is blurring: all industries are becoming knowledge-intensive, absorbing the flow of managerial, financial and commercial innovations. Worker skills and the availability of advanced technology are becoming more important than low labor costs and other conventional factors of competitiveness. The traditional advantages of countries and regions are beginning to lose their former importance. All these tendencies are manifested in almost all countries of the world to a greater or lesser extent. Intangible production is becoming a paradigm of economic development, which forces us to re-evaluate the degree of wealth of countries and regions. Traditionally, countries and regions are assessed in terms of the wealth of forests, minerals, soils, climatic conditions, fixed assets, geographic location... New ideas about intangible production as an area where most of the value is created are changing the criteria for assessing the wealth of countries and regions. In the first place are put forward such factors as wealth in people and their qualifications, management technologies, market infrastructure, business network, culture of organizations. New ideas about the sources and factors of economic development allow a new look at education, science, medicine, telecommunications, management skills as those spheres of public life that have a decisive influence on the pace and direction of the country's economic development as a whole. So, at the regional level, the following criteria and the corresponding indicators of socio-economic development can be considered: 1.GNP or GDP (absolute value and per capita) and growth rates of these indicators 2.Average income level of the population and the degree of their differentiation .The level of real accrued wages .Life expectancy, level of physical and mental health of people .The level of education .Consumption of material goods and services (food, housing, telephone services), provision of households with durable goods .State of the environment The standard way to assess the economic development of a region is to assess the level of production (moreover, as a rule, material production). Such an assessment is today one-sided and insufficient. Developed by international organizations approaches to assessing the economic development of countries force, when assessing the level of development of a region, to consider not only the volume of production, but also such, for example, aspects as education, health care, the state of the environment, equality of opportunities in the economic sphere, personal freedom and culture of life. It is quite appropriate to use the human development index developed and used by the United Nations Development Program to assess the development of individual countries as an integral indicator of the development of a region. When managing the economic development of a particular region, it is advisable to single out all of the above relatively independent goals and monitor their achievement. In particular, along with monitoring the state of regional production and the dynamics of cash incomes of the population, it is necessary to monitor other important parameters of economic development. Availability and quality level of schools, kindergartens, other educational institutions and their availability, as well as the level of education and qualifications of people - the most important parameters of the level of development of any region. Provision of food products, control over their quality, observance of consumer rights in the retail market are also parameters for assessing the level of regional development. The level of physical and mental health of the population, life expectancy, the level of development of the health care system and its availability, the state of the environment are also important evaluation criteria for the socio-economic development of the region. The concept of the socio-economic development of the region also includes such a difficultly measurable substance as the culture of life of the population. The positive dynamics of the economic development of the region is possible only if the culture enriches the life of the population of the region. The socio-economic development of the region only has a positive dynamic when, other things being equal, everyone's personal freedom expands, including in the economic field, which is possible with the effective support of small and medium-sized businesses, antimonopoly measures, consumer protection, and ensuring real freedom of movement. , which is provided by a developed housing market. 1.2 Basic theories and trends in regional development Let us consider some of the basic theoretical concepts underlying the explanation of the main trends in the economic development of regions. The first is the theory of spatial advantage, or placement theory. According to this theory, spatial advantages are manifested in any economic activity. They force certain types of industries to be located in very specific regions. So, the aluminum industry gravitates towards sources of cheap electricity, metallurgical plants- to the places of production iron ore and coke, any production that strongly depends on raw materials is located, as a rule, close to the sources of raw materials. Some industries that are oriented towards local markets and involve significant transport costs are located close to sales markets. Each region, each city has its own territorial advantages associated either with sources of raw materials, or with other factors of production (labor, land, energy), or proximity to sales markets. This theory largely explains the prevailing distribution of productive forces. Other traditional concepts, associated not only with theory, but also with the practice of economic development, are based on the laws of agglomeration, concentration and combination of production. In large cities or urban agglomerations, additional savings or additional economic effect is formed due to the fact that their environment is formed around successfully operating industries and due to the combined use of common resources (labor, energy, infrastructure), additional savings are achieved. The high concentration of industry in large cities allows for additional savings arising from the agglomeration effect (the total costs of all industries in large agglomeration less than the sum of the costs of each production in the case of their single placement outside the boundaries of the given agglomeration). In large centers there is an additional potential for their development due to the fact that some types of highly qualified activities are possible only in large centers (museums, large theaters, medical centers, etc.). A very fruitful concept that makes it possible to effectively analyze the problems of economic development of the region is the concept of main and auxiliary production. In any region, the main industry can be distinguished, i.e. those whose products are mainly exported from the region, and auxiliary production, the products of which are consumed mainly within the region. As an example, we can consider a machine-building plant as the main production and the entire infrastructure serving it - post office, kindergartens, schools, clinics, banks, insurance institutions, forwarding and transport services, construction - as an auxiliary. Usually, with the expansion of the main production, the entire infrastructure serving it also increases; the so-called multiplier effect arises: the main production can be regarded as a kind of accelerator of economic growth. The main production can be not only an accelerator, but also a brake on development, in particular in the case when the number of jobs in the main production is reduced in the process of restructuring. With fairly rapid structural changes due to scientific and technological progress, the main factor for the successful development of the region is not the main, but the auxiliary production. The long-term prosperity of a region depends on how developed its infrastructure is and how ready it is to take on the load of the new main production. The more developed the infrastructure (auxiliary production), the more flexible the entire economy of the region is, the more firmly its economic development and prosperity is based. Thus, in the context of a rapid change in the main industries, the degree of development of the entire urban infrastructure becomes the main factor of sustainable economic development. This gives rise to a new look at the role of the so-called auxiliary industries, to evaluate them as a primary factor in economic development and a guarantee of its prosperity in the future. When analyzing the quality of regional development, it is useful to use the concept of the theory of stages of growth by D. Bell. In all countries and regions, economic development goes through three main stages: pre-industrial, industrial and post-industrial. The dominant sectors of pre-industrial development are extractive industries, agriculture, fishing, forestry and mining. The industrial stage is dominated by processing industries - mechanical engineering, light and food industries. In the post-industrial stage, the main industries on which economic development is based are the industries of non-material production: science, education, trade, finance, insurance, and healthcare. Characteristic features post-industrial society is a relative decline in the production of goods and a relative increase in the production of services, an increase in high-tech production, an increase in the level of qualifications of personnel, and an outstripping internationalization of production. The general laws of world economic development make it possible to qualitatively assess the prehistory and prospects of economic development of a particular city or region. According to the dominant sectoral affiliation, pre-industrial, industrial and post-industrial cities can be distinguished. In cities and regions at different stages of development, processes are different in their essence, and different recipes for managing the process of economic development are applicable to them. At the stage of industrial development in a city or region, there are regularities determined by the role of leading industries, "industry locomotives", which create the so-called multiplier effect and determine the entire course of development of a city or region as a whole. The leading industry creates additional jobs; the rest of the city's infrastructure, as it were, serves the main production. Under these conditions, cities with a single-industry structure are often formed, when one or several enterprises of one industry determine the state of the economy and social sphere of the entire city (Table 1). At the post-industrial stage of development of a city or region, the level of development of urban infrastructure becomes the main factor determining its well-being. How developed are roads, communications, housing, services and entertainment, and how accessible office rooms how low the crime rate is and how well the city is provided with qualified personnel - all this determines the development potential of the post-industrial city. To what extent the entire infrastructure of the city is capable of accepting new types of business and new people, how quickly and efficiently the entire urban infrastructure can adapt to new conditions - all this determines the potential for post-industrial development. Table 1 Industrial and post-industrial stages of development Industrial development Post-industrial development Industry that creates additional jobs Infrastructure Diversification Growth multiplier Development of single-industry cities Flexibility 2. Analysis of the differences in the socio - economic development of the regions of the Russian Federation 1 Analysis of the main indicators of socio - economic development of the country as a whole In order to identify the main trends, differences, problems and to trace the dynamics of the main macroeconomic indicators in the socio - economic development of the regions of Russia, it is necessary to identify the criteria by which the analysis will be carried out. These indicators include: 1.Average per capita income level of the population 2.Provision of healthcare, culture, sports and education institutions .GRP For objectivity and ease of comparison, assessment, comparison and analysis will not be carried out for all 83 constituent entities of the Russian Federation, for federal districts of the Russian Federation. Namely: 1.Central Federal District (main center - Moscow) 2.North-Western Federal District (main center - St. Petersburg) .North Caucasian Federal District (main center - Pyatigorsk) .Southern Federal District (main center - Rostov-on-Don) .Volga Federal District (main center - Nizhny Novgorod) .Ural Federal District (main center - Yekaterinburg) .Siberian Federal District (main center - Novosibirsk) .Far Eastern Federal District (main center - Khabarovsk) But first, let's evaluate these indicators for the country as a whole. 2.1.1 Average per capita money income The dynamics of the average per capita income in the Russian Federation can be traced in Table 2. If we take into account the absolute indicators (average per capita income in rubles), it can be seen that from 2007 to 2011 it increased from 12603 rubles in 2007 to 20712 rubles in 2011. The increase was 8109 rubles. The increase in the average per capita income of the population by years was 2345 rubles in 2008 compared to 2007, in 2009 - 2061 rubles (compared to 2008), in 2010 - 1872 rubles (compared to 2009), in 2011 - 1831 rubles (compared to 20110). Table 2 Average per capita income of the population for the period 2007-2011, rubles Indicator Years 20072008200920102011 rubles per month1260314948170091888120712% period 123.6 118.6 113.8 111 109.7 However, if we trace the dynamics of changes in the average per capita income of the population as a percentage in relation to the previous period, we can note a tendency towards a decrease in the level of average per capita income of the population (Figure 1). Figure 1 Dynamics of the average per capita income of the population for the period 2007 - 2011,%, percent As can be seen from the presented diagram (Figure 1), the increase in the average per capita income of the population is steadily becoming smaller throughout the entire period under consideration. The reasons for this phenomenon may be the crisis of 2008-2009, which caused a decline in production, a reduction in wages, a massive reduction in jobs, as a result of a sharp increase in the number of unemployed. The largest decrease in the level of per capita income of the population falls on the crisis and after the crisis periods from 2008 to 2009. Starting from 2010, the leveling off of changes in this indicator begins. 1.2 Provision of healthcare, education, culture and sports institutions Ensuring high indicators of life expectancy, a high level of education, cultural life are important indicators characterizing socially - economic situation and the development of the country as a whole and its subjects. To maintain a stable level of these indicators, it is necessary to have a sufficient number of healthcare, culture, education and sports institutions. To do this, we will trace the dynamics of changes in the number of cultural institutions, sports, education and health care (Table 3). Table 3 The number of educational, cultural, health care and sports institutions for the period from 2008 to 2011, pieces Indicator Years200820092010201112345Educational68Sport institutions106261132455756819CulturalHealthcare institutions8342748274406533Total159624156008115100137610 According to Table 3, the following conclusions can be drawn: .During the period from 2008 to 2011, the total number of social institutions in the Russian Federation decreased by 22014, namely: The number of educational institutions decreased by 6644 The number of sports establishments decreased by 3,807; a particularly strong decrease in the number of these establishments occurred in 2010. The gap was 5659, or there was a reduction of more than 2 times. The number of cultural institutions decreased by 9755. This is the highest indicator among others. The number of health care facilities decreased by 1809, which is the smallest available indicator. The dynamics of changes in social institutions can be clearly traced in Figure 2. Figure 2 Dynamics of changes in social institutions According to the diagram presented (Figure 2), it can be concluded that: the largest number of social and life support institutions were in 2008; the smallest number of such institutions was observed in 2011; over the period from 2008 to 2011, the number of institutions of this type has been steadily decreasing. The reasons for such a decrease may be a decrease in funding for these institutions, which is caused by budget cuts: insolvency and bankruptcy of cultural, sports, health care and education institutions; reorganization and merger of many institutions from smaller ones to larger ones; the lack of sponsorship and the unsuitability of many buildings for their respective purposes; unprofitable maintenance of such institutions. 2 Analysis of the dynamics of the main indicators of socio - economic indicators by regions of the Russian Federation 2.1 Analysis and assessment of GRP by federal districts of the Russian Federation In order to fully assess the level of socio-economic development of the regions, we will assess and analyze the GRP (Table 4). Table 4 GRP by Federal Districts from 2010-2011 Indicator Years 20102011123 Central FD12927399.311445214.5 S.-Western FD3400346.83405653.5 Southern FD2744849.71988637.6 S.-Caucasian FD698745.8795453.2 Volga FD5349089.34919923.6 Ural FD3486093415 According to table 4, we can say that the GRP from 2010 to 2011. increases in three federal districts: The most complete change in GRP for 2010-2011. can be seen in the presented diagram (Figure 4). Figure 3 GRP by federal districts of the Russian Federation for 2010-2011. As can be seen from the above diagram (Figure 4), the Central federal district, the second place is taken by the Volga Federal District, the third place is taken by the North-West Federal District. The Far Eastern and North Caucasian federal districts have the lowest indicators. The reasons for such indicators may be: The central federal one is in the lead, since a large number of the population is concentrated here, a large number of large enterprises are located here, which bring large incomes, and are also the main taxpayers. The Central Federal District is the most financially secured district; most of the country's financial resources are concentrated here; The Far Eastern District has low rates due to the unfavorable climate, the main source of income is the fishing industry, but since during the winter season, the shipping lanes freeze over and shipping during this time is practically unacceptable. 2.3 Real average monthly wages of employees The real average monthly salary of workers reflects the social and economic situation of the population of the country as a whole and of its individual regions, in particular of the population of the federal districts. Let's analyze and evaluate this indicator for the period from 2008 to 2011 (table 5). Table 5 Real average monthly wages of employees in 2010-2011 Indicator Years 2010 2011 Relative growth in% to the previous period Central Federal District 22404.625376.913 S.-Western Federal District 20892.723531.512.6 Southern Federal District 13274.615560,117.2 Volga Federal District 13987.415613,611.6 S.-Caucasian Federal District 11567.312569,2826.79 Ural Federal District 025034.512.4 Siberian Federal District 26606.418657.6-29.8 Far Eastern Federal District 23157.825814.211.5 According to Table 5, it can be seen that in almost all federal districts the real accrued average monthly wages are increasing. A decrease in this indicator is observed only in the Siberian Federal District. On average, the increase was 999.6 rubles in all federal districts of the Russian Federation (1): ∆У = ∑∆Пр Wed (1), n where ∆У - increase in real accrued average monthly wages; ∑∆Пр Wed - the amount of change (increase, decrease) in real accrued average monthly wages; n is the number of federal districts. Increase in real accrued average monthly wages of employees for 2010-2011 by federal districts was: in the Central Federal District - 2971.4 rubles (or 13%); in the Northwestern Federal District, this indicator increased by 2638.8 rubles (or 12.6%); in the Southern Federal District, the increase was 2285.5 rubles (or 17.2%); The Volga Federal District increased this indicator by 1,626.2 rubles (or 11.6%); The North Caucasian Federal District showed an increase in real accrued average monthly wages by 1001.5 rubles (or 8.7%); an increase in this indicator in the Ural Federal District amounted to 2,765.5 rubles (or 12.4%); the decrease in real accrued average monthly wages in the Siberian Federal District amounted to 7948.8 rubles (or 29.8%); the growth in the Far Eastern Federal District amounted to 2656.4 rubles (or 11.5%). The largest absolute growth is observed in the Central Federal District (2971.4 rubles), the smallest - in the North Caucasus (1001.5 rubles). According to the relative increase, other data are presented: the largest relative increase is observed in the Southern Federal District - 17.2%, the smallest - in the North Caucasus (8.7%). In order to visualize the dynamics of GRP for 2010-2011, let us refer to the diagram (Figure 4). Figure 4 Relative growth of GRP in 2011,%. According to the presented graph (Figure 4), it can be seen that the Southern Federal District has the highest relative growth in 2011 compared to 2010, and the Siberian Federal District has the lowest. The reasons for the highest growth rate of the Southern federal district may be: some enterprises began to experience difficulties in connection with a decrease in prices in the external and internal markets, sales of products, with an increase in consumer receivables for shipped products, a lack of working capital, credit resources, as a result of which they were forced to reduce production volumes, which led to a drop in GRP ... 3 Prospective directions of social and economic development of the regions of the Russian Federation A qualitative forecast can be based on a standard set of scenarios - optimistic, inertial and pessimistic, in order to then impose on each trend the spatial specifics of Russia with various combinations of factors and development barriers. But with any combination, the main development trend will be the contraction of the habitable and economic space. Most likely, an inertial development scenario is being implemented in Russia, continuing the already formed trends in spatial development. Its macroeconomic background is fading recovery growth after the crisis recession of 2008-2009 and relatively low growth rates of the country's economy in the new decade due to stabilization of oil prices and slower growth in global demand for resources. Against this background, spatial development is likely to have quite predictable trends, regardless of the regional policy pursued by the authorities. 1.The exaggerated role of Moscow and the concentration of financial and human resources in it will remain. The Moscow agglomeration will rapidly develop and expand, covering the adjacent areas of neighboring regions. However, artificial innovation projects (Skolkovo) will not change the economic profile of the territories adjacent to the capital; they will continue to develop service, logistics, recreation and industry focused on the huge capital market. The development of St. Petersburg will be highly dependent on federal funding with financial resources and institutional measures ( large companies- taxpayers in northern capital), but these measures are not enough for sustainable growth, the city is hampered by the institutional barriers common to the country. 2.The leading regions of the fuel and energy complex will retain their positions in the group of leaders while maintaining production volumes (this problem is not acute until 2020). But they will have an aging population, a decline in natural growth and an increase in the migration outflow of young people, since few new high-quality jobs are being created in the regions of the fuel and energy complex (an economy based on resource extraction is not labor-intensive). Those who left are already being replaced by the migration inflow of low-skilled labor from the republics of the North Caucasus and Central Asia, which will inevitably increase social tension, drug addiction problems and increase the burden on the social protection system of the population. .A considerable part of the regions from the group of leaders of the second echelon may slide down into the “middle” group. For the leading metallurgical regions, this is a consequence of a decrease in global competitiveness due to the aging of Soviet industrial assets, increased costs due to the rise in the cost of fuel and raw materials. Some developed multifunctional industrial regions, primarily Samara Region(decline in the competitiveness of the automotive industry) and the Perm Territory (depletion mineral resources and the lack of new large investments). .Subject to relative political stability in the Caucasus, more rapid growth of large Russian regions of the south will continue due to sustainable advantages - more developed infrastructure, the presence of seaports, resource advantage in the form of better soil and agro-climatic conditions. The Olympics are likely to hinder the sustainable growth of the south due to the excessive concentration of investments at one point and the inevitable problems of unprofitable sports and other facilities after the completion of this Putin project. .The depopulation of the Non-Black Earth Region and other peripheral territories of European Russia will increase due to the high natural decline; the concentration of the population will continue in regional centers and other larger cities, but above all in the agglomerations of federal cities. The problem of the degrading periphery will not be resolved due to low mobility of the population and barriers to housing markets in cities. .A large group of regions "median" in terms of the level of development will remain, with small rotation upward (several regions with a favorable coastal position and southern industrial-agrarian ones) or downward (semi-suppressive regions of machine-building and textile specialization). .Despite ambitious federal programs, not only will the shrinkage of habitable space continue (which is good for the economy), but also the degradation of the entire settlement system of the Far East and Transbaikalia (which is bad), with the exception of the largest regional centers - Vladivostok, Khabarovsk and, perhaps, Yuzhno Sakhalinsk and Ulan-Ude. The economy of the eastern regions will be even more polarized - along with the centers of growth (capitals of the regions, leading port cities and zones for the extraction of export raw materials), the rest of the territory will degrade infrastructurally and lose population. With the growth of federal budget revenues, the resumption of expensive infrastructure projects in the East and North is possible, but they will face an inglorious economic end. .The republics of the North Caucasus will remain a “black hole” of budget funding, but labor migration of young people to other regions of Russia will grow in them, which, given the beginning of the process of declining fertility (except for the period of its stimulation in 2007-2009), will slightly alleviate the problem of unemployment. For the underdeveloped republics of Siberia (Tyva, Altai), this valve will never start working due to remoteness and stronger cultural barriers. Chechnya will continue to be the favorite for funding from the federal budget, but depending on the political situation, Ingushetia and Dagestan may be added to it. The worst-case scenario - stagnation and socio-economic degradation - not only enhances the tendencies of peripheral degradation described above, but also sharply reduces the number of promising growth zones due to deteriorating institutional conditions and reduced investment. This is quite possible with the degradation of the political regime. Briefly, we can formulate the most dangerous trends in spatial development for the future. 1.A rapid deterioration in the quality of life in the Moscow metropolitan agglomeration due to infrastructure and environmental problems, while the population continues to grow. The degradation of the social environment can stimulate the emigration of the most competitive population (young people, people with a high level of education and higher incomes). 2.In the next decade, one should not expect an accelerated compression of the habitable space in the peripheral territories; the prospect of their depopulation is more long-term - by 2030-2050. Another adaptation strategy of the population of peripheral territories is more likely. different kind(the aged Non-Black Earth Region, eastern and northern regions), which has already formed and will continue to grow. This is a reduction in legal employment, which provides labor guarantees and protection, and an increase in self-employment of the population using traditional sources of income - land resources (private household plots), forest gifts (picking mushrooms and berries), forest resources (illegal logging in the taiga zone), fish (illegal fishing in the Far East, on the rivers of Siberia and in the Astrakhan region). An archaic shift in the structure of employment not only contributes to the degradation of human capital, but leads to an increase in ineffective budgetary spending on maintaining social infrastructure in economically half-dead territories and on social protection of their population (unemployment benefits, social benefits, etc.) .The growth of tension, ethnic contradictions and clannishness in the republics of the North Caucasus, which will stimulate the migration outflow of educated and more modernized urban residents to other regions. The loss of "agents of modernization" will reproduce and intensify traditionalism and conflicts. At the same time, the flow of low-skilled labor force, expelled from their regions by conflicts and lack of work, will increase to federal cities. .A sharp slowdown in the economic development of large cities - regional centers due to a lack of investment and deteriorating institutional conditions. This will lead to an even greater concentration of high-quality human capital in federal cities... It is even more important that this will limit the possibilities to transmit to the regions the impulses of all forms and types of modernization - consumer, behavioral, value. In Russia big cities are the most important "translators" of innovations, ensuring their progress down the hierarchical system of cities in their region and into the suburbs. This list of problems is quite enough to predict a significant decline in human capital in Russia, without which the country will not be able to develop normally. An optimistic scenario of sustainable investment growth is possible only with a significant improvement in institutions (protection of property rights, reduction of corruption, etc.) and an increase in the openness of the country's economy. Even bad infrastructure is a less rigid barrier, since it can develop as economic growth, this was shown by the example of the Sakhalin Oblast. In the optimistic forecast of spatial development, one can distinguish the main differences from the inertial scenario. 1.Expansion of the geography of realized resource benefits. Since Russia's resource advantages remain the most significant, the implementation of the optimistic scenario will accelerate the development of oil and gas producing and transit regions of the European North (Murmansk Oblast, Nenets Autonomous Okrug and the Komi Republic), Siberia (Yamalo-Nenets Autonomous Okrug, Krasnoyarsk Territory) and the Far East (Yakutia, Sakhalin Region) thanks to projects of joint fuel production using Western technologies. 2.Maximum use of the resource advantage of fertile and vast land resources. Rapid development of the agricultural sector and food processing in the regions of the European South (in the first place), as well as the regions of the Volga region and the South farther from the export routes Western Siberia... Stimulation and support of the state in order to strengthen the positions of Russian producers in the world food market. .Rapid expansion of the economic zone of the Moscow metropolitan agglomeration. This process is quite active, but so far it covers only the border areas of neighboring regions along major highways and the centers of individual regions with a more favorable investment climate (Kaluga). With the reduction of barriers, all regions around Moscow will receive an additional inflow of investments in order to create goods and services for the huge market of the metropolitan agglomeration. The second component of this process is road construction to reduce the economic distance; it should be implemented by the state in partnership with business. .Accelerating the development of large regional centers. Growing consumer demand will stimulate the growth of Russian and foreign investment in the service sector and food industry large cities - regional centers and their suburban areas, since this demand is not yet saturated. The first will attract the investment resources of the million-plus cities and those close to them in number, competing for investors. This, firstly, will reduce the hypertrophy of the Moscow metropolitan agglomeration and, secondly, the competitive development of city-centers will accelerate the process of modernization of municipal institutions. .Realizing the advantages of being close to developed countries. In the regions bordering the EU countries (Karelia and other regions of the North-West), a decrease in the barrier function of the border and an improvement in the investment climate will contribute to the inflow of investments in the forestry processing industries and industries supplying products to the St. Petersburg agglomeration market, as well as some labor-intensive manufacturing industries. This is a typical development trend for the border regions of the CEE countries, which has not been implemented in Russia due to institutional barriers. .Expansion of the geography of the realized advantages of the seaside transit position. Growth zones will form. Unlike the western and southern coastal regions, the coastal zones of the more populated regions of the Far East (Primorsky and Khabarovsk Territory, Sakhalin) are not yet using their advantages due to strong institutional barriers and less developed infrastructure. Reducing the institutional barriers of "gangster capitalism" will allow attracting the necessary investments in infrastructure, which, in coordination with rational infrastructure projects of the state, will create the necessary conditions for business development. The influx of Chinese investment and controlled labor recruitment will also contribute to the growth of the economy of the Far East, especially its large cities. .Formation of innovation development centers outside the Moscow agglomeration. This function can be performed by several large cities of the country (Tomsk, Novosibirsk, etc.) with preserved scientific potential in various fields of science. With the improvement of the investment climate, they will be able to receive venture financing, including foreign ones. Generating domestic demand for innovation remains a longer-term challenge. In such cities, educational and scientific complexes (high-quality university + modern research structures) with an effective system of stimulating scientific activity will be developed. Unfortunately, the advantage of higher quality human capital is not sufficiently expressed in most large cities in Russia, so there will be few such innovation centers. .Improving the effectiveness of regional policy in the peripheral territories. And under the optimistic scenario, vast peripheral areas will remain in Russia, but the state will stimulate the mobility of the population, facilitating migration (primarily for young people). In addition, more effective - mobile and targeted - forms of social services and assistance to vulnerable groups of the population of peripheral territories will be developed. Having studied the theoretical foundations and investigated the differences in the socio-economic development of the regions of the Russian Federation, with the help of statistical information, the goal of the educational and research work was achieved and the tasks were completed. Thus, we can draw conclusions: 1.In order to identify the main trends, differences, problems and to trace the dynamics of the main macroeconomic indicators in the socio - economic development of the regions of Russia, it is necessary to identify the criteria by which the analysis will be carried out. These indicators include: Average per capita income level of the population Provision of healthcare, culture, sports and education institutions 2. GRP from 2010 to 2011 increases in three federal districts: in the Far Eastern Federal District amounted to 183032.4 rubles; in the North Caucasian Federal District, the increase amounted to 96707.4 rubles; in the Northwestern Federal District, the increase was 5306.7. A decrease in GRP can be observed in the rest of the federal districts: the decrease in the indicator for the Ural Federal District amounted to 462869.4 rubles; in the Siberian Federal District, the GRP decreased by 101225 rubles; The Volga Federal District has a decrease in the indicator by 429165.7 rubles; The Central Federal District lost 1,482,184.8 rubles in GRP; the decrease in the estimated indicator in the Southern Federal District amounted to 756,212.1 rubles. The Central Federal District has the largest decrease (by 14%), the smallest - the Siberian Federal District (by 2.9%). The largest increase in GRP is observed in the Far Eastern Federal District - 183032.4 rubles (11.8%), the smallest increase is in the GRP in the North Caucasian Federal District - 5306.7 rubles (0.76%). The central federal one is in the lead, since a large number of the population is concentrated here, a large number of large enterprises are located here, which bring large incomes, and are also the main taxpayers. The Central Federal District is the most financially secured district; most of the country's financial resources are concentrated here; The Volga Federal District ranks second, because is located in a convenient natural and climatic zone, there are favorable conditions for agriculture, and large industrial enterprises are also concentrated; The Northwestern Federal District ranks third, because it is also one of the most densely populated districts of the country; this federal district includes the Republic of Karelia, which also brings great profits to this federal district. The reason for the backwardness of the North Caucasian Federal District is its small territory, which is also the reason for the low GRP; The Far Eastern District has low rates due to the unfavorable climate, the main source of income is the fishing industry, but since during the winter season, the shipping lanes freeze over and shipping during this time is practically unacceptable. The Southern Federal District has the greatest value of the relative growth of GRP in 2011 compared to 2010, and the Siberian Federal District has the least importance. The reasons for the highest growth rate in the Southern Federal District may be: Available natural resources create favorable conditions for the development of production of building materials and mining; The Southern Federal District is one of the most important suppliers of agricultural products for Russia. Grain, sugar beets, fruits, vegetables, grapes, melons and gourds, fish, livestock products are exported outside the okrug; The development of the tourist and recreational complex ensures the creation of new jobs, increases the standard of living of the population, and contributes to the development of medical services for the population. In the republics that are part of the Southern Federal District, there are already attractive tourist zones that have significant potential for the development of the tourism industry. The reasons for the sharp decline in the GRP of the Siberian Federal District may be: the recent tragedy at the Sayano-Shushenskaya GRES, which led to a drop in energy production, and, accordingly, to a drop in profits; some enterprises began to experience difficulties in connection with a decrease in prices in the external and internal markets, sales of products, with an increase in consumer receivables for shipped products, a lack of working capital, credit resources, as a result of which they were forced to reduce production volumes, which led to a drop in GRP ... 5. Further development of the regions can proceed according to three scenarios - pessimistic, optimistic and inertial. List of sources and literature used 1.Adamesku A., Kistov V. Regional programs: promising issues. // The Economist. - 2011. - No. 6 - p.68-72. 2.Adamchuk V.V., Romanov O.V., Sorokina M.E. Economics and Sociology of Labor: Textbook for universities. - M .: UNITI. 2008. .Barygin, I.N. Basics of regional studies: Tutorial/ I.N. Barygin. - M .: Garadariki, 2007 .-- 399 p. .E.V. Vavilova Economical geography and regional studies: Textbook. - M .: Gardariki, 2000. .A.I. Gavrilov Regional economy and management / textbook / A.I. Gavrilov. - M .: Infra-M, 2002. .A.I. Gavrilov Regional economics and management. -2002. .Galperin V.M. Microeconomics / Galperin V.M., Ignatiev S.M., .A.G. Granberg Fundamentals of Regional Economics. State University « graduate School economy ". - M., 2000. .Gutman, G.V. Regional Economy Management / G.V. Gutman [and others]. - M .: Finance and statistics, 2001. - 288 p. .Ketova, N.P. Fundamentals of regional economics / N.P. Ketova [and others]. - M .: Rostov-nD, 2009 .-- 348 s .Leksin, V.N. State and Regions: Theory and Practice of State Regulation of Territorial Development / V.N. Leksin, A.N. Shvetsov, - M .: URSS, 2007 .-- 368 s .Marshalova, A.S. Fundamentals of the theory of regional reproduction / A.S. Marshalova, A.S. Novoselov A.S. - M .: Economics, 2006 .-- 426 p. .V.I. Morgunov; total ed. Galperina V.M. - In 2 volumes. Vol.2. - S-Pb: .Development of regions and enterprises in the context of Russia's accession to the WTO.- Ufa, UI RGTEU, 2005. - 250 p. .Regional Economy / Ed. MV Stepanova., M., "Infra-M", 2001. .Chernik D.G. National economy / textbook REA named after G.V. Plekhanov / - M.: REA, 2002. .School of Economics, 2009 .-- 503s .Yusupov K.N. Regional economics (theory and practice). - Ufa, BashSU Publishing House, 2000 .-- 128 p. 19. . Social and cultural activities The types of social and cultural activities are revealed in the works of such authors as A.N. Ilyina, R. Osborne, Yu.A. Streltsov. etc. Chapter 1. Theoretical foundations of the types of social and cultural activities.
ESD includes the development of social relations, therefore it proceeds differently in the specific historical conditions of the technological structures of the economy and society, the distribution of material wealth.
The goals of the socio-economic development of the region are such as increasing income, improving education, nutrition and health care, reducing poverty, improving the environment, equality of opportunity, expanding personal freedom, enriching cultural life. Some of these goals are identical, but under certain conditions they can differ significantly. Thus, limited funds can be directed either to the development of health care or to environmental protection. A conflict arises between development goals. At the same time, it is clear that the cleaner the environment is, the healthier the population will be and the more the ultimate goal of human health will be achieved. Therefore, in this case, the conflict between goals is not absolutely insoluble. However, in other cases, the conflict of development goals requires special consideration and special methods of resolution.