That part of the nature of the Earth, with which humanity interacts in its life and activities, is called natural, or the environment.
The material basis for the development of human society is the wealth of nature. All components of nature can be considered depending on the degree of their involvement in material production or as natural conditions or as natural resources.
Elements of nature that are directly used (or can be used) by man in his production activities are called natural resources. Natural resources that cannot be completely exhausted are called inexhaustible. These include the energy of the Sun, wind, tides, rivers, nuclear energy; natural resources that can be completely depleted are called exhaustible. Exhaustible natural resources include renewable (biological, land and water) and non-renewable (mineral) resources.
Those elements of nature that are not directly used by man in his production activities, but significantly affect his development, are called natural conditions. These primarily include relief, geological structure and climate.
The line separating the concepts of natural conditions and natural resources is rather arbitrary. For example, wind acts as an important natural condition that affects such elements. economic activity people, as water and air transport, agriculture, etc. At the same time, it is an important resource, primarily for energy. As society developed, natural conditions and natural resources had different meanings, others were simply not used by man, since there was no need for them. Natural resources are a historical category associated with changes in the needs and capabilities of society, the development of science and technology at different historical stages. For example, in the era of scientific and technological revolution, the importance of non-ferrous metal ores and energy resources has sharply increased.
There are different approaches to the classification of natural resources (table 4). By origin, mineral, water, resources of the World Ocean, land, biological, climatic, space resources... Exhaustible and inexhaustible are distinguished. By way of use: agro-climatic, energy, recreational, etc.
Table 4
Resource availability is the ratio between the amount of (explored) natural resources and the extent of their use. It is expressed either by the number of years for which the resource should be sufficient, or by its reserves per capita at the current rates of extraction or use. According to experts, general geological reserves of mineral fuel should be sufficient for more than 1000 years.
There are two ways to assess the provision of a country with a certain type of natural resources. The first is to divide the size of the reserves of a given resource by the current production volume per year and get the number of years for which this resource should be sufficient. The second is to divide the amount of reserves of a given resource by the population of the country and find out how much of this resource is per capita. By quantitatively assessing the country's resource availability, one can draw conclusions about the degree of its provision with this resource.
Of course, the indicator of resource availability is primarily influenced by the wealth or poverty of the territory with natural resources. But since resource availability also depends on the scale of their extraction (consumption), this concept itself is not natural, but socio-economic.
Scientifically grounded economic assessment of natural resources is of great importance in the process of nature management. Its constituent elements are exploration, identification, inventory, as well as quantitative and qualitative assessment of natural resources.
Resource availability around the world, taking into account the current level of production:
- coal - over 3000 years old;
- iron ore - 460 years;
- gas - 50 years;
- oil - 36 years.
Placement of natural resources
The distribution of natural resources around the planet is characterized by unevenness. Between countries and major regions modern world there are noticeable differences in the level and nature of their provision with natural resources.
The distribution of mineral resources is explained by differences in climatic and tectonic processes on Earth and different conditions for the formation of minerals in past geological eras.
Fuel minerals are of sedimentary origin and usually accompany the cover of ancient platforms and their inner and foredeeps.
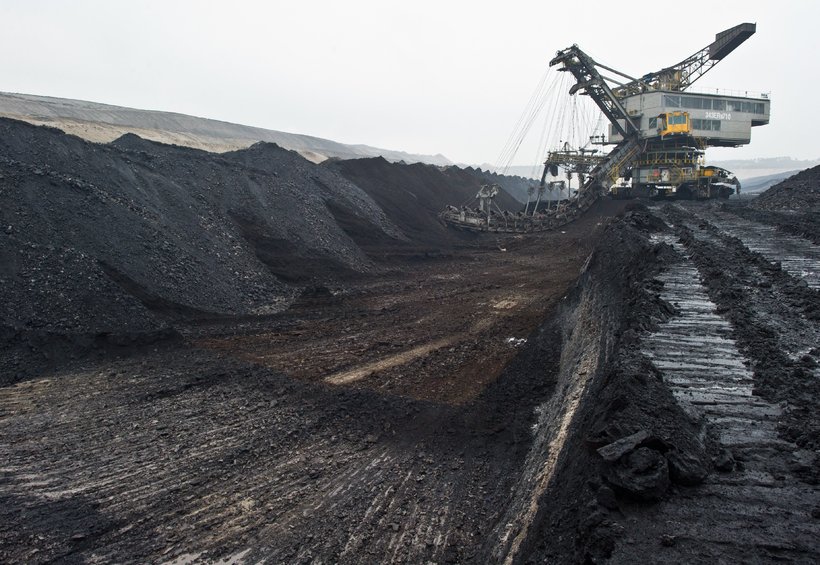
On the the globe more than 3.6 thousand coal basins are known, which together occupy 15% of the earth's land area. Of the total coal reserves, 40% falls on brown coal and 60% - on hard coal. Explored reserves account for 8% of the total. More than 90% of all coal resources are located in the Northern Hemisphere - Asia, North America, Europe.
The ten largest coal basins in the world: Tunguska, Lensky, Kansko-Achinsky, Kuznetsk, Ruhr, Appalachian, Pechora, Taimyr, Zapadny, Donetsk.
Most of both general and proven reserves are concentrated in economically developed countries (Table 5).
Table 5. Countries distinguished by explored coal resources (2007)

More than 600 oil and gas basins have been explored, 450 are being developed. The main reserves are located in the Northern Hemisphere, mainly in the Mesozoic sediments. An important place belongs to the so-called giant fields with reserves of over 500 million tons and even over 1 billion tons of oil and 1 trillion cubic meters of gas each. There are 50 giant oil fields (more than half are located in the countries of the Near and Middle East), gas - 20 (they contain over 70% of all reserves, such deposits are most typical for the CIS countries).
The largest oil and gas basins: Persian Gulf, Maracaiba, Orinok, Gulf of Mexico, Texas, Illinois, California, West Canadian, Alaska, Severomorsky, Volga-Ural, West Siberian, Daatsin, Sumatra, Gulf of Guinea, Sahara.
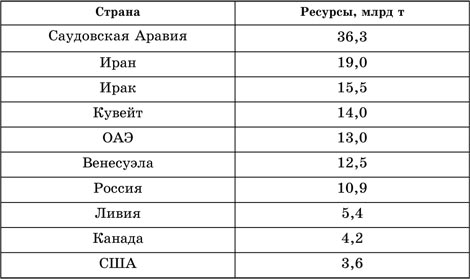
The world's total oil reserves are about 170 billion tons, including:
Foreign Asia - 108 billion tons;
America - 26 billion tons;
Africa - 15.6 billion tons;
Foreign Europe - 2.1 billion tons;
Australia and Oceania - 2.3 billion tons.
Table 6. Countries distinguished by proven oil resources (2007)
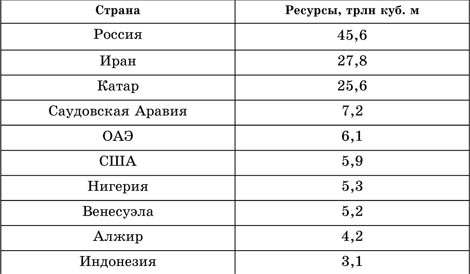
In the CIS - 16.0 billion tons, of which: in Russia - 66%, in Kazakhstan - 30%, in Azerbaijan - 2%, in Turkmenistan - 2%. The world's total gas reserves are 135 trillion cubic meters. In terms of natural gas reserves, two regions are distinguished: the CIS (Western Siberia, Turkmenistan, Uzbekistan) and the Middle East (Iran). They are distributed by country as follows:
Table 7. Countries distinguished by explored gas resources (2007)
Uranium (nuclear feedstock) is very widespread in earth crust, but it is economically profitable to develop only deposits containing at least 0.1% uranium (1 kg - $ 80). According to the IAEA, Australia, South Africa, Niger, Brazil, Namibia, Russia stand out in terms of uranium reserves.
Ore minerals usually accompany foundations and ledges of ancient platforms, as well as folded areas. In such areas, they often form vast ore (metallogenic) belts - Alpine-Himalayan, Pacific, etc.
The largest reserves of iron ore are concentrated in the USA, China, Russia, India, Brazil, Australia, Canada, Liberia, and Sweden. About 1,100 million tons are produced annually iron ore.
Of the non-ferrous metals, the most common is aluminum, the content of which in the earth's crust is 10% by weight. Mainly deposits of aluminum ores are found in tropical and subtropical zones... Several bauxite-bearing provinces are distinguished:
- Mediterranean: France, Italy, Greece, Yugoslavia, Hungary, Romania;
- Coast of the Gulf of Guinea: Guinea, Ghana, Sierra Leone, Cameroon;
- Coast The Caribbean: Jamaica, Haiti, Dominican Republic, Guyana, Suriname;
- Australia.
There are also reserves in the CIS and China.
The main resources of copper ores are concentrated in Zambia, Zaire, Chile, USA, Canada, Peru, the Philippines; lead-zinc ores - in the USA, Canada, Australia; tin ores - in Malaysia, Indonesia, Bolivia, Brazil, Thailand.
Nonmetallic minerals are mineral chemical raw materials (sulfur, phosphorites, potassium salts), building materials, refractory raw materials, graphite, etc. They are quite widespread.
Land resources. The earth is one of the main resources of nature, sources of life. Land resources are necessary for human life and for all sectors of the economy. There are as many of them on the planet as there is land, which makes up 29% of the earth's surface.
Land resources - the surface of the Earth, on which various objects of the economy, cities and others can be located settlements... These are mostly territorial resources. But when assessing the territory, from the point of view of the possibilities for the development of agriculture and forestry, it is important to consider the quality of lands - their fertility, since the land in this case is the main means of production. Provision of mankind land resources is determined by the world land fund, which is 13.4 billion hectares. Of the individual large regions, Africa (30 million km 2) and Foreign Asia (27.7 million km km 2). However, if we consider the provision of regions with land resources per capita, then the result will be the opposite: for each inhabitant of sparsely populated Australia there are 37 hectares of land (the maximum indicator), and for every inhabitant overseas Asia- only 1.1 hectares, about the same in foreign Europe. The structure of the land fund shows how land resources are used.
The most valuable are cultivated lands (11%), which provide 88% of the foodstuffs necessary for mankind and are mainly concentrated in the forest, forest-steppe and steppe zones of our planet. Of no small importance are meadows and grazing lands (23% combined), which provide 10% of the food consumed. Agricultural land - arable land, meadows, pasture land. Forests and shrubs occupy 30%. Urbanized locations - 2%. Unproductive and unproductive lands - 34%.
In the CIS, African countries and North America the share of cultivated land is close to the world average. For overseas Europe this figure is higher (29%), and for Australia and South America- less high (5 and 7%). The countries of the world with the largest cultivated land are the USA, India, Russia, China, Canada. The cultivated land is concentrated mainly in forest, forest-steppe and steppe natural zones. Natural grasslands and pastures prevail over cultivated land everywhere (in Australia more than 10 times), except in foreign Europe. Globally, an average of 23% of the land is used for pasture. Resource availability of land is determined per capita. Australia ranks first in terms of land per capita. The largest sizes of cultivated land are in the USA, India, Russia, and China. The main tracts of arable land are in the Northern Hemisphere: Europe, Southern Siberia, Eastern, Southeast and Southern Asia, the plains of Canada and the United States. The countries with the lowest provision of arable land per capita are China (0.09 ha), Egypt (0.05 ha).
The polar spaces in Greenland, in the north of Russia, Canada, Alaska are unsuitable for processing; desert regions of Central Australia, the highlands of Central Asia, the Sahara desert, etc. Processes are taking place: desertification - the sands of the Sahara, the deserts of South-West Asia, North and South America; destruction of lands by quarries, filling with dumps, flooding by created reservoirs.
However, the structure of the land fund does not remain unchanged. It is constantly influenced by two opposite processes:
- on the one hand, land is being expanded, virgin lands are being developed (Russia, USA, Kazakhstan, Canada, Brazil). Land-poor countries are attacking coastal areas (the Netherlands, Belgium, France, Portugal, Japan, Canada, Singapore, etc.);
- on the other hand, the deterioration and depletion of land is going on all the time. It is estimated that due to erosion, waterlogging, salinization, about 9 million hectares fall out of agricultural circulation annually. There is a growth of cities, in arid regions - desertification threatens to reach 3 billion hectares.
Therefore, the main problem of the world land fund is the degradation of agricultural land, as a result of which there is a noticeable reduction in cultivated land per capita, and the "load" on them is constantly increasing.
Water resources. These are waters suitable for use in the economy: rivers, lakes, canals, reservoirs, groundwater, soil moisture, glacier water. More recently, water was considered one of the free gifts of nature and water resources belonged to the category of inexhaustible.
However, fresh water resources account for 2.5% of the volume of the hydrosphere. As its consumption grows in many regions of the Earth, its shortage begins to be felt. In addition, as a result of pollution of rivers and lakes, their waters become unsuitable for human use. Therefore, water resources are depleted.
Most of the fresh water is "conserved" in the glaciers of Antarctica, Greenland, in the ice of the Arctic, in mountain glaciers and is still practically inaccessible for use.
The main source of fresh water is rivers. Of all the river waters of the planet (47 thousand km 3), only half can really be used. The water of the lakes is referred to as static reserves due to slow water exchange, although an insignificant share of reserves (on average 1.5-2% of their total volume, and in Lake Baikal - 0.3%) is renewed annually.
The consumption of fresh water is about 5 thousand km 3 per year and is constantly growing, while the resources of the river flow remain unchanged. This poses the threat of a shortage of fresh water. The main consumer of fresh water is agriculture, where its irretrievable consumption is high (about 89%). Thus, irrigation accounts for 69% of consumption. Industry consumes 21%; utilities - 6%; reservoirs - 4%.
To solve the problem of water supply, projects of economical water consumption are used, the construction of reservoirs, desalination sea water, redistribution of river flow; projects for the transportation of icebergs are being developed. Countries are provided with water resources in different ways. About 1/3 of the land area is occupied by the arid belt, which is home to 850 million people. Countries with insufficient water resources include Egypt, Saudi Arabia, Germany; with medium security - Mexico, USA; with sufficient and excessive security - Canada, Russia, Congo.
Fresh water supplies on Earth are extremely unevenly distributed. In the equatorial belt and in the northern part temperate zone it is abundant and even abundant.
The availability of water resources is calculated as the amount of river flow per capita.
The most abundant countries are those with more than 25 thousand m3 per capita per year ( New Zealand, Congo, Canada, Norway, Brazil). In the arid belt of the Earth, which covers about 1/3 of the land area, the water shortage is acutely felt. The most dry countries are located here, with less than 5 thousand m3 per capita (Egypt, Saudi Arabia, Algeria, China, India, Germany, Poland).
Only 1/3 of the population uses good-quality water, 1/3 is insufficiently provided with it, and another 1/3 uses poor-quality drinking water. In Africa, 10% of the population is provided with regular water supply, in Europe - more than 95%.
There are several ways to solve the water problem of mankind. Perhaps the main one is a decrease in the water intensity of production processes and a reduction in water losses. The construction of reservoirs (USA, Russia, China) that regulate river flow is of great importance. In the USA, Canada, Australia, India, Mexico, China, Egypt, the CIS countries, numerous projects for the territorial redistribution of river flow by means of its transfer have been implemented or are being designed. In the countries of the Persian Gulf, the Mediterranean, in Turkmenistan, in the Caspian Sea, seawater desalination is used. There are projects to transport icebergs from Antarctica. It is possible to stop the discharge of industrial, agricultural and municipal wastewater into inland water bodies and the sea. A significant amount of water can be obtained by collecting rain and melt water in underground storage facilities. A large resource is groundwater, readily available in many parts of the world, for example, in the Sahara. Fresh water resources can be increased by using a closed circulating economy.
The river runoff is also used to generate electricity. China, Russia, USA, Zaire, Canada, Brazil have the largest hydropower potential. The degree of utilization of the hydropower potential depends on the level of development of the country.
Forest resources are one of the most important types of biological resources. Forests provide for the diverse needs of people. They not only serve as a raw material base for the forestry and timber processing industry, but are also one of the main elements of the recreational potential, a human habitat, regulate and purify water flows, effectively prevent erosion, preserve and increase soil fertility, most fully preserve the genetic diversity of the biosphere, enrich the atmosphere oxygen and protect the air basin from pollution, largely shape the climate. Vegetable world forests is a unique supplier of wild fruits and berries, nuts and mushrooms, valuable types of medicinal herbs and specific technical raw materials for various industries. At the threshold of the emergence of agriculture, according to existing estimates, forests covered 62 million km 2, or more than 2/5 of the land surface of our planet, and taking into account other types of forest vegetation, this area was 75 million km 2.
The world's forest resources are characterized by two important indicators: the size of the forest area (4 billion hectares) and standing timber reserves. Forest resources are renewable. But since forests are reduced for arable land, construction, wood is used as firewood, as a raw material for woodworking and other types of industries (production of paper, furniture, etc.), the problem of reducing forest resources and deforestation of territories is quite acute. For the rational use of forest resources, it is necessary to comprehensively process raw materials, not to cut down forests in an amount exceeding their growth, and carry out reforestation work.
The world's forests are unevenly distributed. They form two approximately equal in area and timber reserves forest belts- north and south. Northern - in the zone of temperate and partly subtropical climate. The most wooded countries of the northern belt are Russia, USA, Canada. Finland, Sweden. Southern belt - in the zone of tropical and equatorial climates... Major forest areas southern belt: Amazon, Congo Basin, Southeast Asia, countries: Congo, Brazil, Venezuela.
Forest resources (forests) are called the "lungs" of the planet; they play a huge role in the life of all mankind. They restore oxygen in the atmosphere, preserve groundwater, and prevent soil destruction. Mixing rainforest The Amazon leads to the disruption of the planet's "lungs". Preservation of forests is also necessary for the health of mankind.
The provision of forest resources in individual countries is calculated per capita. Each inhabitant of the planet has less than 1 hectare of forests, in Canada - more than 8, in Finland - 4, in Russia - 5.3; and in the USA it is only 0.8 hectares. Standing timber per capita on average in the world is 65 m 3, in Canada - more than 570 m 3, in Russia - 561 m 3, in Finland - over 370 m 3 and in the USA - about 83 m 3.
Biological land resources. They belong to the category of exhaustible renewable (but exhaustible) natural resources. The total number of currently known species of life on Earth is about 2 million units, and their actual number is likely to exceed 10 million (mainly due to not yet open views rainforest).
Wildlife forms the basis for agriculture and forestry, fishing, hunting and other industries, for the whole variety of economic and social activities of the population.
Resources of the World Ocean. These resources must be considered comprehensively, since they include: biological resources; mineral resources seabed; energy resources, sea water resources.
The state of stocks of aquatic biological resources, their effective management is becoming increasingly important both for providing the population with high-quality food products, and for supplying raw materials for many industries and agriculture (in particular, poultry farming). The available information indicates an increasing pressure on the oceans. In the 1980s, leading scientists predicted that by 2025 world fishery production will reach 230-250 million tons, including from aquaculture - 60-70 million tons. In the 1990s, the situation changed: forecasts of sea catches for 2025 decreased to 125-130 million tons, while the forecasts of the volume of fish production due to aquaculture increased to 80-90 million tons. At the same time, it is considered obvious that the growth rate of the Earth's population will exceed the growth rate of fish production.
Biological resources - fish, molluscs, crustaceans, cetaceans, algae. About 90% of the commercial objects being caught are fish. The offshore zone accounts for more than 90% of the world's catch of fish and non-fish species. Most of the world's catch is taken in the waters of the temperate and high latitudes of the Northern Hemisphere. Of the oceans, the biggest catch is Pacific Ocean... Of the seas of the World Ocean, the most productive are the Norwegian, Bering, Okhotsk, and Japanese.
Mineral resources of the World Ocean are solid, liquid and gaseous minerals. The coastal-marine placers contain zirconium, gold, platinum, and diamonds. The subsoil of the shelf zone is rich in oil and gas. The main areas of oil production are the Persian, Mexican, Gulfs of Guinea, the coast of Venezuela, the North Sea. There are offshore oil and gas regions in the Bering and Okhotsk Seas. They extract from the subterranean depths iron ore(off the coast of Kyushu Island, in the Hudson Bay), coal (Japan, Great Britain), sulfur (USA). The main wealth of the deep-sea floor of the ocean is ferromanganese nodules.
Sea water is also a resource of the World Ocean. It contains about 75 chemical elements. About 1/3 of the common salt produced in the world, 60% of magnesium, 90% of bromine and potassium are extracted from the waters of the seas. The waters of the seas in a number of countries are used for industrial desalination. Largest manufacturers fresh water - Kuwait, USA, Japan.
Of the energy resources of the World Ocean, tidal energy is mainly used. There are tidal power plants in France at the mouth of the Rhone River, in Russia - the Kislogubskaya TPP at Kola Peninsula... Projects for using the energy of waves and currents are being developed and partially implemented.
With the intensive use of the resources of the World Ocean, its pollution occurs as a result of the discharge of industrial, agricultural, household and other waste into rivers and seas, shipping, and mining. Oil pollution and the disposal of toxic substances and radioactive waste in the deep-sea parts of the ocean pose a particular threat. The problems of the oceans require coordinated international measures to coordinate the use of its resources and prevent further pollution.
Recreational resources. Recreational resources include:
1) objects and natural phenomena that can be used for recreation, tourism and treatment;
2) cultural and historical sights.
The first group includes sea coasts with a favorable climate, the banks of rivers and lakes, mountains, forests, mineral springs, healing mud. Resort areas, recreation areas, nature reserves, and national parks are being created in areas with such recreational resources.
The second group includes monuments of history, archeology, architecture and art. Most of the ancient cities of Europe and Russia are rich in cultural and historical sights, the Egyptian pyramids and temples of Luxor, the Taj Mahal mausoleum in India, the remains of the ancient Mayan and Aztec cities in Latin America are world famous.
The richest recreational resources are found in countries where favorable natural conditions are combined with cultural and historical attractions. First of all, these are the Mediterranean countries - Italy, Spain, Greece, Turkey, Israel, Egypt, Tunisia, such European countries as France, Switzerland, Austria, the Czech Republic, as well as Mexico, India, Thailand.
Large reserves of basic minerals are distributed across countries as follows.
1. Oil - Saudi Arabia, Kuwait, Iraq.
2. Natural gas - Russia, Iran, United Arab Emirates.
3. Stonecoal - China, USA, Russia.
4. Iron ore - Brazil. Russia. China.
5. Copper ores - Chile. USA, Zaire.
An analysis of the global provision of mankind with non-renewable mineral resources allows us to draw a number of conclusions.
1. Explored mineral resources on Earth are limited, especially in the upper layers of the lithosphere, which are most convenient for industrial extraction, and require constant monitoring of their use. .
2. The degree of provision of certain types of mineral resources is not the same, which can have profound environmental consequences. The category of highly scarce resources includes mineral resources, the supply period of which is calculated for 10-20 years. These include Au, Pb, Co, Zn, Sn, and diamonds. The next category covers the mineral resources, the provision of which is calculated for the next century. These are oil, Mo, asbestos, Cu, gas, Ti, tungsten and vanadium. The third category is conventionally limited mineral resources - they will last for several hundred years. This category includes rock and potassium salts, Mn, Fe, phosphates, Cr, U, coal, Al and other minerals.
Russia is provided with all types of mineral raw materials and, in terms of their explored reserves, takes a leading place among the largest countries in the world. More than half of the world's coal and peat reserves, half of the timber reserves, 1/3 of oil and gas, 2/5 of iron ores, 2/5 of potassium salts, 1/4 of phosphorites and apatites are concentrated in the country.
The cost of Russia's resources, according to experts, is 27 trillion. US dollars, and its national wealth is estimated at 3.3 trillion. dollars.
At the same time, most of the mineral deposits in the Russian Federation are of low quality, the content of useful climatic conditions). As a result, despite the presence of significant proven reserves, the degree of their industrial development is rather low.
Significant losses of minerals occur during their transportation to the places of processing and use. On the territory of Russia, 350 thousand km of field pipelines are in operation, on which more than 50 thousand breakthroughs occur annually. As a result, 2,650 tons of oil from main pipes and 1,438 tons of oil products are spilled per year.
17. Land resources
Soil cover- the most important natural education. The soil is a food source that provides 95-97% of food resources for the world's population.
A special property of the soil cover is its fertility, which is understood as the totality of soil properties that ensure the yield of agricultural crops.
The Earth's soil resources suitable for agriculture are currently 40% depleted.
The involvement of new lands in agricultural circulation is due to the deforestation of tropical forests, which is fraught with the threat of a global environmental catastrophe. The development of these lands cannot solve the problem of increasing food production. The soils of tropical forests are poorly fertile, contain a lot of iron and aluminum. After clear cutting, tropical showers wash away a thin layer of humus, and a very strong red solid rock - iron ore - forms on the surface. The land becomes barren and unfit for cultivation. Iron ore already cover more than 10% of the tropics.
The land area is 149 million square meters. km. 13% is cultivated, and 90% of the food is obtained from here. The small proportion of arable land in relation to the land area gives the impression that land resources are inexhaustible. But there are environmental barriers to farming. This is the climate and relief.
The distribution of agricultural land per capita in different countries varies widely. In Japan this figure is 0.07 hectares, in the USA - more than 2, in Canada - more than 3, Australia - more than 40 hectares.
Agriculture is not the only consumer of land resources. Growth in industrial production, mining, expansion of urban areas and transport networks, protected areas, etc. reduce land resources.
The territory of Russia is large, but 65% of it is located in the permafrost zone, i.e. in harsh climatic conditions. About 10% of the territory of the Russian Federation is a tundra zone with primitive soils. The humus layer has a thickness of 2-3 cm, its content is a fraction of%. The soils are waterlogged, there are many swamps. Most of all in the country are podzolic soils - 30% of the territory. The humus horizon is from 5 to 20 cm, the humus content is 2-4%. Podzols are acidic, they need liming. On the large area they are waterlogged. The forest-steppe zone with gray forest soils occupies 1% of the territory. This is one of the most developed areas, the share of arable land reaches 80% of the area. The steppe zone occupies 9% of the territory. It is distinguished by chernozem soils and insufficient moisture. Chernozems have a thickness of a humus layer of 40 to 170 cm and a humus content in the upper part of 4 to 20%. The entire soil cover of the zone is plowed up and eroded.
Russia is in fifth place among countries with an effective territory (km 2 / person): Brazil - 8.05, USA - 8, Australia - 7.68, China - 5.95, Russia - 5.51, Canada - 3 , 64, India - 2.9, Kazakhstan - 2.62. Consequently, the area of effective territory in Russia is 1.5 times less than in the United States and only 2 times more than in Kazakhstan, and stretched out for many thousands of kilometers, which complicates the organization of transport
Almost all agricultural lands in Russia are located in areas of risky farming and large areas are located in the permafrost zone.
The growing season in Russia is 100 days shorter than in France, Italy and Austria. Russia is the coldest country on the planet, and in order to maintain the same standard of living as in the mentioned countries, different energy costs are needed. In Russia, they should be 2-3 times more than in Western Europe.
Soils lose their fertility due to degradation, which can be natural and man-made.
Natural soil degradation is the washing out of nutrients from fertile soils by rain moisture. The complete destruction of soils occurs under the influence of strong earthquakes, surges and tides.
Technogenic soil degradation occurs as a result of errors in human agricultural activities, such as soil pollution, erosion of arable soils on slopes, destruction of soils by quarries, mines, degradation of pastures due to overloading during grazing.
Irrigated agriculture is the most efficient form of land use in agriculture. Each irrigated hectare gives 4-5 times more production than non-irrigated one. Therefore, more than 50% of the world harvest is harvested from irrigated lands, which make up only 13% of the arable land area. But even with low soil salinity, crop yields are sharply reduced (wheat - by 50-60%). Salinization affects up to 40% of all irrigated land in the world. Increased irrigation rates lead to a significant rise in the level of mineralized (slightly salted) groundwater, salts from which rise to the surface through soil capillaries.
The phenomenon of soil salinization is observed in many countries of irrigated agriculture in Asia, Africa, America. As a result of secondary salinization, tens of millions of hectares have turned into unproductive saline soils and salt deserts.
In large areas, soil productivity decreases due to a decrease in humus content. In the last 20 years alone, humus reserves have decreased by 25-30%, and the annual losses in the RF as a whole amount to 81.4 million tons. About 43% of the arable land in the RF is characterized by a low humus content.
The most abundant water resources are the following countries: Brazil (8 233 km 3), Russia (4 508 km 3), USA (3 051 km 3), Canada (2 902 km 3), Indonesia (2 838 km 3), China (2 830 km 3), Colombia (2 132 km 3), Peru (1 913 km 3), India (1 880 km 3), Congo (1 283 km 3), Venezuela (1 233 km 3), Bangladesh (1 211 km 3), Burma (1,046 km 3).
Volume of water resources per capita by countries of the world (m3 per year per capita)
Most of the water resources per capita are found in French Guiana (609,091 m 3), Iceland (539 638 m 3), Guyana (315 858 m 3), Suriname (236 893 m 3), Congo (230 125 m 3), Papua New Guinea (121 788 m 3), Gabon (113 260 m 3), Bhutan (113 157 m 3), Canada (87 255 m 3), Norway (80 134 m 3), New Zealand (77.305 m 3), Peru (66 338 m 3), Bolivia (64 215 m 3), Liberia (61 165 m 3), Chile (54 868 m 3), Paraguay (53 863 m 3), Laos (53 747 m 3), Colombia ( 47 365 m 3), Venezuela (43 846 m 3), Panama (43 502 m 3), Brazil (42 866 m 3), Uruguay (41 505 m 3), Nicaragua (34 710 m 3), Fiji (33 827 m 3), Central African Republic (33 280 m 3), Russia (31 833 m 3).
The least water resources per capita are in Kuwait (6.85 m 3). United Arab Emirates(33.44 m 3), Qatar (45.28 m 3), the Bahamas (59.17 m 3), Oman (91.63 m 3), Saudi Arabia (95.23 m 3), Libya (95 , 32 m 3).
On average, on Earth, each person has 24,646 m 3 (24,650,000 liters) of water per year.
The next card is even more interesting.
The share of transboundary runoff in the total annual runoff of rivers of the countries of the world (in%)
Few countries in the world rich in water resources can boast that they have "at their disposal" river basins that are not separated by territorial boundaries. Why is it so important? Take, for example, the largest tributary of the Ob - the Irtysh. ()
... The source of the Irtysh is located on the border of Mongolia and China, then the river for more than 500 km flows through the territory of China, crosses the state border and flows about 1,800 km through the territory of Kazakhstan, then the Irtysh flows about 2,000 km through the territory of Russia until it flows into the Ob. According to international agreements, China can take half annual flow Irtysh for their needs, Kazakhstan is half of what will remain after China. As a result, this can greatly affect the high flow of the Russian section of the Irtysh (including hydropower resources). At present, China annually Russia 2 billion km 3 of water. Therefore, the water availability of each country in the future may depend on whether the sources of rivers or sections of their channels are outside the country. Let's see how things are going with strategic "water independence" in the world.
The map presented to your attention above illustrates the percentage of the volume of renewable water resources entering the country from the territory of neighboring states, of the total volume of the country's water resources. (A country with a value of 0% does not "receive" water resources from the territories at all neighboring countries; 100% - all water resources come from outside the state).
The map shows that the following states are most dependent on the "supply" of water from the territory of neighboring countries: Kuwait (100%), Turkmenistan (97.1%), Egypt (96.9%), Mauritania (96.5%) , Hungary (94.2%), Moldova (91.4%), Bangladesh (91.3%), Niger (89.6%), Netherlands (87.9%).
In the post-Soviet space, the situation is as follows: Turkmenistan (97.1%), Moldova (91.4%), Uzbekistan (77.4%), Azerbaijan (76.6%), Ukraine (62%), Latvia (52, 8%), Belarus (35.9%), Lithuania (37.5%), Kazakhstan (31.2%), Tajikistan (16.7%) Armenia (11.7%), Georgia (8.2%) , Russia (4.3%), Estonia (0.8%), Kyrgyzstan (0%).
Now let's try to do some calculations, but first let's make ranking of countries by water resources:
1. Brazil (8 233 km 3) - (Share of transboundary flow: 34.2%)
2.Russia (4,508 km 3) - (Share of transboundary flow: 4.3%)
3. USA (3 051 km 3) - (Share of transboundary flow: 8.2%)
4. Canada (2 902 km 3) - (Share of transboundary flow: 1.8%)
5.Indonesia (2 838 km 3) - (Share of transboundary flow: 0%)
6.China (2 830 km 3) - (Share of transboundary flow: 0.6%)
7. Colombia (2,132 km 3) - (Share of transboundary flow: 0.9%)
8. Peru (1 913 km 3) - (Share of transboundary flow: 15.5%)
9. India (1 880 km 3) - (Share of transboundary flow: 33.4%)
10. Congo (1 283 km 3) - (Share of transboundary flow: 29.9%)
11. Venezuela (1 233 km 3) - (Share of transboundary flow: 41.4%)
12. Bangladesh (1 211 km 3) - (Share of transboundary flow: 91.3%)
13. Burma (1,046 km 3) - (Share of transboundary flow: 15.8%)
Now, based on these data, we will draw up our rating of the countries whose water resources are least dependent on the potential reduction in transboundary flow caused by water abstraction by upstream countries.
1. Brazil (5,417 km 3)
2.Russia (4314 km 3)
3. Canada (2 850 km 3)
4.Indonesia (2,838 km 3)
5.China (2 813 km 3)
6. USA (2 801 km 3)
7. Colombia (2,113 km 3)
8. Peru (1,617 km 3)
9. India (1,252 km 3)
10. Burma (881 km 3)
11. Congo (834 km 3)
12. Venice (723 km 3)
13. Bangladesh (105 km 3)
In conclusion, I would like to note that the use of river waters is not limited to just one water intake. Do not forget about the transboundary transfer of pollutants, which can significantly worsen the quality of river waters in river sections located in other countries downstream.
With stock map groundwater You can familiarize yourself with.
(Visited 30,932 times, 17 visits today)
We live in the most beautiful rich country in the world, and all other countries envy us ...
So it is, or not, we will not argue, let everyone decide for himself) However, it is Russia that is the richest country in terms of natural resources. We have the largest reserves of natural gas and timber, but this, as you understand, is far from all. Let's see who else belongs to the countries whose resources are estimated at tens of trillions of dollars.
1st place: Russia
The total value of Russia's natural resources exceeds $ 75 trillion. Of these, 28.5 trillion are timber reserves (1.95 billion acres), 19 billion are in natural gas and $ 7 billion in oil. In addition, Russia is in second place in coal reserves and in third place in gold deposits. After such numbers, the words from the song involuntarily come to mind: "After all, this is our common gas, and dreams come true only with you."
2nd place: USA
The value of the natural resources of the United States is estimated at about $ 45 trillion. The lion's share make up timber reserves (about $ 11 trillion), as well as coal reserves of about $ 30 trillion. It also has large reserves of natural gas, copper and gold.
3rd place: Saudi Arabia
Saudi Arabia's resources are estimated at $ 34.4 trillion, of which 31.5 trillion are in oil and 2.9 trillion in natural gas. It is in this country that the largest oil reserves on the planet are concentrated - about 20% of the world's total. However, these resources are being depleted very quickly, and experts assume that in a few decades Saudi Arabia will drop out of the top ten richest countries altogether.
4th place: Canada
Canada's total mineral reserves are worth $ 33.2 trillion. However, this is how the country “got rich” recently: in 2009-2010, new oil sands were discovered, which added about 150 billion barrels of oil. Now oil in the country is about $ 21 trillion (178 billion barrels). It is also in the top three in terms of the amount of wood and uranium.

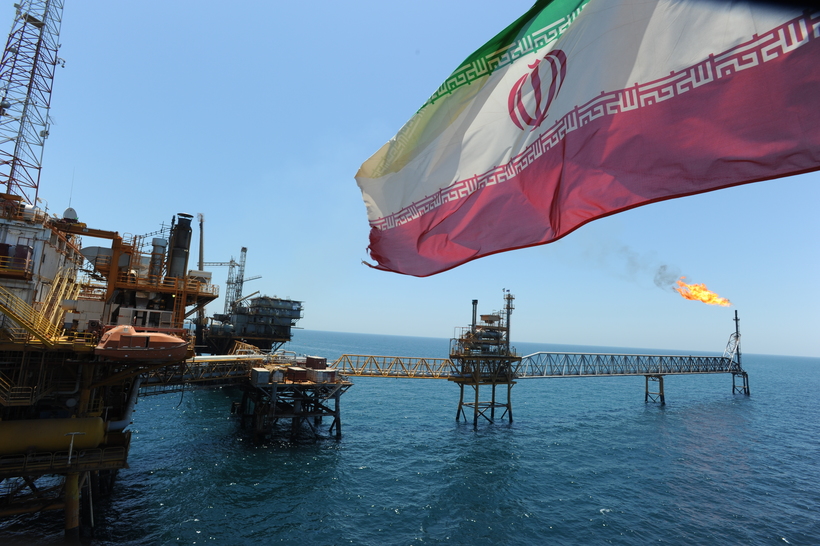
5th place: Iran
The total value of Iran's natural resources is $ 27.3 trillion. Most of them are in oil reserves (16 trillion) and gas (11 trillion). Iran owns part of the giant natural gas field in the Persian Gulf, which it shares with Qatar. Therefore, Iran will be among the top three for these minerals.
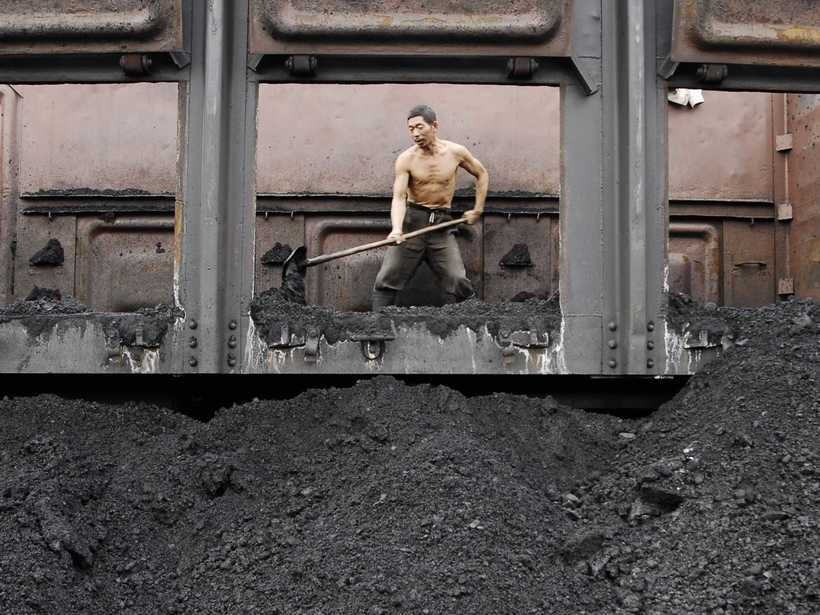
6th place: China
Another resource-rich country is China. The country has reserves of about $ 23 trillion, of which the main resources are timber and coal.
A few words about the richest country
Of course, when compiling ratings in which Russia occupies a leading position, and even with a decent margin, they do not take into account production efficiency and sectoral structure... In addition, a general assessment of the amount of all natural resources of the country is difficult, many researchers speak of fundamentally different figures.
Today, more than 20 thousand oil fields have been discovered in Russia, coal, natural gas, non-ferrous, rare, ferrous and precious metals, as well as other minerals. Despite this amount, most of these deposits and the content of useful components in them are of low quality: on average 35-50% lower than reserves in the world. Add to this the inaccessibility: harsh climatic conditions, poor transport facilities, remoteness of deposits. Therefore, the development of natural resources in Russia is quite low, and few reserves have been developed at least 50%.
However, all this is the best way to help to represent the entire financial opportunity and power of Russia. It remains to wait and hope that we will feel this financial power) Or at least our children.
Business American site 24/7 Wall St. (24/7 Wall Street) has conducted a study of the countries with the largest and most valuable natural resources on Earth.
We used estimates of total reserves, the most expensive and used resources: oil, natural gas, coal, timber, gold, silver, copper, uranium, iron ore and phosphates, and their market value. According to sources: US Geological Survey, US Energy Information Administration, Bloomberg, etc.
The richest countries in the world with natural resources
1.Russia
Total resource cost: $ 75.7 trillion.
Oil reserves: 60 billion barrels; cost: $ 7.08 billion
Natural gas reserves: 1.680 trillion cubic meters cub. feet ( 47.58 trillion cub. m); cost: $ 19 billion
Wood stocks 1.95 billion acres; cost: $ 28.4 trillion
Russia richest country on natural resources, ... It ranks first among all countries in the world in terms of natural gas reserves (27.5%) and timber, second in the world in terms of coal and rare earth minerals deposits (rare earth minerals are currently not mined). In third place in terms of gold deposits.
2. United States
Total resource cost: $ 45 trillion
Oil reserves: not in the top 10
Natural gas reserves: 272.5 cubic meters m; cost: $ 3.1 trillion
Timber reserves: 750 million acres; cost: $ 10.9 trillion
In the United States, 31.2% of the world's coal reserves. They are estimated at $ 30 trillion. Wood and coal, taken together, account for approximately 89% of the total value of a country's natural resources. The United States is also among the top five countries with global reserves of copper, gold and natural gas.
3. Saudi Arabia
Total resource cost: $ 34.4 trillion
Oil reserves: 266.7 trillion. barrels; cost: $ 31.5 trillion
Natural gas reserves: 258.5 trillion. m cube; cost: $ 2.9 trillion
Saudi Arabia owns about 20% of the world's oil - the largest share of any country. In the fifth place in the world in terms of natural gas reserves. Resources are rapidly depleting, and in a few decades, Saudi Arabia will fall out of this ranking.
4. Canada
Total resource cost: $ 33.2 trillion
Oil reserves: 178.1 billion barrels; cost: $ 21 trillion.
Wood stock: 775 million acres cost: $ 11.3 trillion
The recently discovered oil sands (2009-2010) have added about 150 billion barrels to Canada's total oil. Canada ranks third in timber reserves and second in uranium reserves.
5.Iran
Total resource cost: $ 27.3 trillion.
Oil reserves: 136.2bn. barrels; cost: $ 16.1 trillion
Natural gas reserves: 991.6 trillion. cub. m; cost: $ 11.2 trillion
Wood stock: not in the top 10
Iran shares a giant with Qatar gas field in the Persian Gulf South Pars / North Dome. The country has about 16% of the world's natural gas reserves, according to this indicator it ranks second in the world. And in third place in terms of oil reserves in the world (more than 10% of world oil reserves).
6. China
Total resource cost: $ 23 trillion
Oil reserves are not in the top 10
Natural gas reserves: not in the top 10
Wood stock: 450 million acresCost: $ 6.5 trillion
The main resources of China are coal reserves (more than 13% of the total in the world) and rare earth minerals. Shale gas deposits have recently been discovered. After their assessment, China's status as a leader in natural resources will only improve.
7. Brazil
Total resource cost: $ 21.8 trillion
Oil reserves: not in the top 10
Natural gas reserves: not in the top 10
Timber reserves: 1.2 billion acres; cost: $ 17.5 trillion
Possesses large reserves of gold and uranium. Owns 17% of the world's iron ore. But the most valuable resource is timber, 12.3% of the world's timber reserves. Recently discovered offshore oil reserves were not included in the report. Since, there is still no accurate estimate (according to preliminary data, reserves may reach 44 billion barrels of oil).
8. Australia
Total resource cost: $ 19.9 trillion
Oil reserves: not in the top 10
Natural gas reserves: not in the top 10
Wood stock: 369 million acres cost: $ 5.3 trillion
Australia has the largest gold reserves in the world (14.3% of world reserves). It also supplies 46% of the world's uranium. In addition, the country has significant amounts of natural gas offshore the northwest coast, which it shares with Indonesia. Australia has an enormous supply of timber, coal, copper and iron. The country is in the top three in terms of total reserves of 7 out of 10 resources on this list.
9. Iraq
Total resource cost: $ 15.9 trillion
Oil reserves: 115 billion barrels; cost: $ 13.6 trillion
Natural gas reserves: 111.9 trillion. cub. ft (3.15 trillion cubic meters); cost: $ 1.3 trillion.
Wood stock: not in the top 10
Iraq's greatest wealth is oil - 115 billion barrels of proven reserves (9% of the world's total oil). Iraq also has one of the most serious phosphorite reserves in the world, worth more than $ 1.1 trillion, and these deposits are not fully developed.
10. Venezuela
Total resource cost: $ 14.3 trillion
Oil reserves: 99.4 billion barrels; cost: $ 11.7 trillion
Natural gas reserves: 170.9 trillion. cub. ft (4.8 trillion cubic meters); cost: $ 9 trillion
Wood stock (value): not in the top 10
Venezuela is one of the 10 largest holders of iron, natural gas and oil resources. Natural gas reserves in this South American country are ranked eighth in the world and amount to 179.9 trillion. cub. pounds (just over 2.7% of world reserves). It contains 99 billion barrels of oil (7.4% of the world's total reserves).
Just press the button of your social. networks at the bottom of the screen!
A source : The World's Most Resource-Rich Countries - 24/7 Wall St.