Russia took 5th place in the world in 2015 in terms of natural export volumes iron ore... In customs statistics, this product is represented by the TNVED code 2601. For 9 months of 2016, the export of iron ore from Russia exceeded 13 million tons.
Dynamics of export of iron ore by months
Iron ore supplies abroad do not have a pronounced seasonality. The largest volume fell on March - 1.93 million tons.
| Year-month | Volume, tons | Cost, USD | Exporters | Declarations |
| 2016-01 | 748 758 | 29 876 228 | 8 | 21 |
| 2016-02 | 1 286 378 | 54 043 846 | 8 | 37 |
| 2016-03 | 1 963 908 | 66 033 825 | 8 | 42 |
| 2016-04 | 1 388 254 | 60 084 911 | 7 | 34 |
| 2016-05 | 1 811 609 | 71 129 377 | 9 | 47 |
| 2016-06 | 1 641 919 | 66 575 853 | 7 | 64 |
| 2016-07 | 1 412 716 | 84 742 735 | 9 | 34 |
| 2016-08 | 1 503 499 | 71 568 913 | 8 | 52 |
| 2016-09 | 1 345 855 | 65 877 914 | 8 | 46 |
| Total | 13 102 895 | 569 933 602 | 377 |
Commodity structure
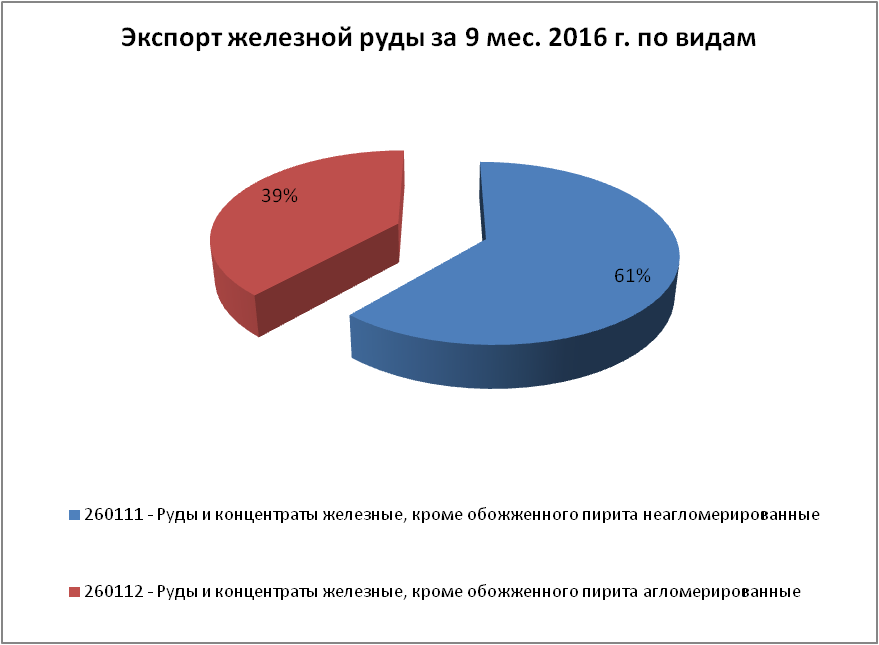
Exported iron ore is divided into two main types: agglomerated (that is, roasted and prepared for the production of pig iron) and non-agglomerated. The cost of roasted ore is almost twice as high as that of non-agglomerated ore: $ 61 per ton against $ 32.6. Unfired ore accounts for 61% of the natural volume of Russian exports, but more than half of the proceeds comes from roasted ore.
| TNVED code and description | Volume, tons | Cost, USD | Average price USD / ton | Exporters | Declarations |
| 260111 - Iron ores and concentrates, other than roasted pyrite, not agglomerated | 8 056 584 | 262 378 898 | 32,57 | 13 | 241 |
| 260112 - Iron ores and concentrates, except for roasted pyrite, agglomerated | 5 046 311 | 307 553 102 | 60,95 | 5 | 135 |
| 260120 - Calcined pyrite | 0 | 1 602 | 16 020,40 | 1 | 1 |
| Total | 13 102 895 | 569 933 602 | 16 113,91 | 377 |
Iron ore exports by destination countries
China is the main buyer of Russian iron ore: almost exactly one third of exports - 4.36 million tons. The next notable importers are Slovakia, Ukraine, Turkey and Finland with volumes ranging from 1 to 1.76 million tonnes. Moreover, Turkey buys the most expensive ore with an average cost of $ 87.36 / ton and has spent as much money on it as Slovakia and Ukraine combined.
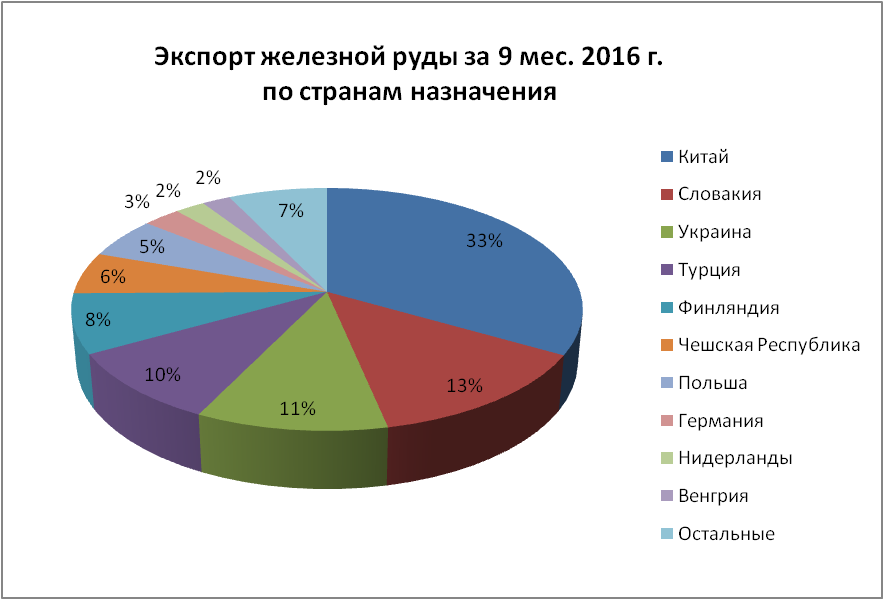
| Destination country | Volume, tons | Cost, USD | Average price USD / ton | Exporters | Declarations |
| China | 4 358 886 | 167 115 028 | 38,34 | 7 | 87 |
| Slovakia | 1 757 518 | 63 653 703 | 36,22 | 4 | 48 |
| Ukraine | 1 386 974 | 46 919 593 | 33,83 | 9 | 42 |
| Turkey | 1 259 285 | 110 008 599 | 87,36 | 4 | 38 |
| Finland | 1 039 390 | 57 673 145 | 55,49 | 1 | 9 |
| Czech Republic | 731 367 | 19 597 147 | 26,80 | 5 | 40 |
| Poland | 712 527 | 22 339 633 | 31,35 | 1 | 23 |
| Germany | 359 276 | 25 374 596 | 70,63 | 2 | 10 |
| Netherlands | 284 268 | 9 276 849 | 32,63 | 1 | 9 |
| Hungary | 271 664 | 9 748 326 | 35,88 | 4 | 23 |
| Rest | 941 738 | 38 226 984 | 40,59 | 4 | 48 |
Iron ore exporters
Fifteen exporting companies took part in the supply of iron ore abroad during the period under review. These are mainly mining companies - mining and processing plants. Secondary traders and carriers have minor shares in the total volume.
| Exporter | Volume, tons | Cost, USD | Average price USD / ton | Foreign company-counterparties | Declarations |
| JSC "LEBEDINSKY GOK" | 4 088 091 | 150 060 692 | 36,71 | 37 | 162 |
| JSC "KARELSKY OKATYSH" | 2 380 111 | 145 192 696 | 61,00 | 5 | 24 |
| OJSC "STOILENSKY GOK" | 1 988 395 | 62 498 031 | 31,43 | 12 | 64 |
| JSC "KOVDORSKY GOK" | 1 894 483 | 64 240 240 | 33,91 | 1 | 19 |
| OJSC "MIKHAILOVSKY GOK" | 1 789 710 | 76 785 629 | 42,90 | 16 | 70 |
| OLEKMINSKY MINES LLC | 543 884 | 23 066 817 | 42,41 | 2 | 7 |
| JSC "EVRAZ KGOK" | 236 154 | 44 999 827 | 190,55 | 5 | 12 |
| METALL-GROUP LLC | 136 468 | 2 502 600 | 18,34 | 4 | 8 |
| LLC "GPK LUNEN" | 44 981 | 541 202 | 12,03 | 1 | 3 |
| LLC "RUSSIAN ANTHRACITE" | 279 | 17 861 | 64,13 | 1 | 1 |
| JSC "RZD LOGISTICS" | 140 | 11 221 | 80,15 | 1 | 1 |
| LLC "Colors" | 140 | 13 935 | 99,68 | 1 | 1 |
| LLC "IRZHTRANS" | 60 | 1 181 | 19,68 | 1 | 3 |
| JSC "GB" | 0 | 1 602 | 16 020,40 | 1 | 1 |
| KURSK BATTERY PLANT LLC | 0 | 70 | 2 200,95 | 1 | 1 |
When republishing or otherwise using this material, reference to the source is required.
Metallurgy is one of the basic industries and provides mankind with construction materials, ferrous and non-ferrous metals. For a long time, this industry has developed very actively, but since the 70s of the twentieth century, there has been a slight slowdown in its growth. This is due primarily to a decrease in the metal consumption of production. Today, the following trends in the development of metallurgy are visible:
- Changing the proportions between developed and developing countries in favor of the latter;
- Weakening of the previous fuel and raw materials orientation and strengthening of orientation towards transport routes;
- Strengthening customer focus;
- Transition from large enterprises (mills) to medium and small.
Metallurgy includes all processes - from ore mining to rolled metal production. It includes two branches: ferrous and non-ferrous metallurgy.
Ferrous metallurgy of the world
However, not all of these countries export ore. Its largest exporters are Australia (165 million tons per year) and Brazil (155), provide about 60% of world exports. In addition, major exporters of iron ore are India (37), South Africa (24), Canada (22), Ukraine (18), Sweden (14), Mauritania (10), Russia (7), Venezuela (7).
In general, about 500 million tons (almost 50%) are exported annually.
Many, including mining iron ore- USA, Great Britain, Italy, China, etc., it is imported. The largest importers are Japan (125 million tons per year), China (110), European countries (primarily Germany), the Republic of Korea, and the United States. This is due to the fact that despite certain structural changes that have occurred in. industries, the main type of enterprises in the ferrous metallurgy of most developed countries are plants full cycle... Ferrous metallurgy of a full cycle is distinguished by a high material consumption of production, i.e., a high consumption of materials used in relation to the weight of the finished product. The consumption of iron ore is especially high, and somewhat less consumption of coking coal. For the smelting of 1 ton of pig iron, at least 1.5-2 tons of iron ore are consumed (the richer the ore is in iron, the less its consumption), from 1-1.2 tons of coking coal, and only 4-5 tons of raw materials and fuel. Due to this ideal places For the development of ferrous metallurgy, countries and regions rich in both iron and manganese ores and fuel have always been considered. For example, India, China, Kazakhstan, Australia, Donetsk-Pridneprovsky region of Ukraine are distinguished by a combination of resources of iron and manganese ores, coking coal. But such a favorable combination for ferrous metallurgy natural resources is not common, therefore many metallurgical regions and centers arose either near the mining of iron ore (for example, in Lorraine in Germany, Pennsylvania in the USA, Donbass, in Russia, etc.).
In addition to the old, traditional regions of ferrous metallurgy, which arose in certain countries of the world either on a combination of iron ore and coal, or separately on coal, iron ore or scrap metal replacing them, the industry, especially in last years developed very actively in the coastal areas. This option for the placement of ferrous metallurgy provides the opportunity for the supply of raw materials and fuel and the export of finished products by sea. Moreover, in many cases, the import of iron ore (or scrap) and coal is more profitable than the exploitation of local bases and deposits. For example, in Japan, almost all factories are located along the coast, which is very convenient for obtaining iron ore and coal by sea (iron ore to Japan is supplied by Australia, India, Brazil, and coal - by Australia and China). Large metallurgical plants created in the port cities of Italy (Naples, Genoa, Taranto), France (Marseille, Dunkirk), USA (Baltimore, Philadelphia), (Wuhan), Germany, and other countries. In all these cases, as in Japan, the location of metallurgy is determined by the orientation towards imported iron ore and coal (for European countries, iron ore comes from Africa and Latin America, coal - from the USA; for the USA, iron ore comes from Brazil, Venezuela and Canada ).
Main iron ore bridges:
- Australia - East Asia;
- Australia -;
- Brazil - East Asia;
- Brazil - Western Europe;
- Brazil - USA;
- South Africa - East Asia;
- South Africa - Western Europe;
- India - East Asia;
- India - Western Europe;
- Venezuela - USA;
- Canada - USA;
- Canada - Western Europe;
- Ukraine - overseas Europe;
- Russia is a foreign Europe.
Pig iron smelting is the most material-intensive process in ferrous metallurgy. About half of all steel in the world is obtained from cast iron. The complex economic and environmental problems of blast-furnace production slow down the growth of pig iron production in the world (the volume of its production has not grown in the last decade). There have been changes in the geography of blast furnace production: the total share of Western Europe and North America for the period from 1950 to 2000. in pig iron smelting decreased from 75% to 30%, and of Eastern Europe and Asia increased from 20 to 60%. The leadership of the countries also changed: in 1950-1960. - USA; in 1970 - 1990 - the USSR, and after 1991 the PRC became the absolute leader. The production of pig iron in Russia and Ukraine decreased especially significantly.
Steel... The main intermediate product for obtaining rolled products, on the quality of which all products of various industries and construction depend. The raw material for steel production is cast iron. However, as the resources of secondary raw materials accumulate in more and more countries of the world, the primary stages of metallurgy (blast furnace production) have been replaced by the use of domestic or imported scrap metal.
In the United States, almost half of steel is produced not from pig iron, but from scrap (mainly in new factories located in the West and South). Roughly the same situation in other developed countries, newly industrialized countries (especially Asian) and in Russia.
The achievements of scientific and technological revolution almost completely replaced the old methods of steel production (for example, open-hearth furnace). Modern technologies: the oxygen-converter method and electric arc furnace are decisive. They made it possible to reduce the smelting time, as well as to obtain steel on small units, and to use resources more efficiently. A new revolutionary technology was the method of producing steel from metallized pellets obtained from ore. This direct iron reduction process replaces iron smelting. All this made it possible to move to specialized enterprises, which are more free in their location. This led to a new trend in the placement of ferrous metallurgy - consumer orientation.
World production of steel, especially high quality steel, continues to grow. But since the mid-1970s, the growth rate has slowed down somewhat. In 2000, it reached 850 million tons, i.e. 1.5 times more than cast iron.
Places among the regions for its production are distributed differently from the extraction of iron ore: overseas Asia(360 million tons per year) - 42.4%, foreign Europe (195) - 22.9%, North America (120) - 14.1%, CIS (100) - 11.8%, Latin America (55) - 6.5%, Africa (12) - 1.4%, Australia and Oceania (8) - 0.9%
Among the countries the leaders are: China (145 million tons per year), Japan (105), USA (100), Russia (58), Germany (46), Republic of Korea (43), Ukraine (30), Brazil (28), India (27), Italy (27).
In the world steelmaking, the share of developing countries is constantly increasing (about 40% of steel is smelted), first of all, new industrial ones (Republic of Korea, Brazil, India, Mexico, etc.). However, the highest quality types of steel are smelted in developed countries, including Russia.
Rental- the final, most valuable, product of the entire cycle of ferrous metallurgy. Its cost is 2-5 times more than the cost of the steel from which it is made. Rolled products are very diverse (up to 20-30 thousand types and names). Rolled steel is the main product of the iron and steel industry. Not only enterprises but also entire countries specialize in its production. The best grades of rolled products are produced in the USA, Japan and Western Europe).
The main exporters of steel and rolled products are Japan, Germany, France, Belgium, Korea, Italy, USA, Russia, Great Britain, Ukraine.
The main importers are the USA, Germany, China, France, Italy, Belgium, Canada, Fr. , Great Britain, R. Korea.
Non-ferrous metallurgy
Includes the production of non-ferrous, precious, rare metals and their alloys. Non-ferrous metallurgy in terms of production is about 20 times less than ferrous, but has a wide range of products. Non-ferrous metallurgy, like ferrous metallurgy, has recently been growing at a higher rate in developing countries.
Non-ferrous metallurgy is distinguished by some features that affect the placement.
- High material consumption of production, making it unprofitable to separate processing from the places of extraction of raw materials. The percentage of most non-ferrous metals in ores is small (usually from fractions of a percent to several percent), which predetermines the "linkage" of ore processing enterprises to the places where raw materials are mined.
- High energy intensity of production, which makes the development of the industry efficient from sources of cheap fuel and electricity. Since the production (smelting) of metals from enriched raw materials requires a lot of energy, the stages of enrichment and metallurgical processing in non-ferrous metallurgy often turn out to be territorially fragmented.
- The complex nature of the raw materials used. Many non-ferrous metal ores are polymetallic in nature, that is, they contain several metals. For the purpose of their complete extraction (use) in nonferrous metallurgy, production combination is effective.
- The widespread use of secondary raw materials in the production of resources (in developed countries, 25-30% of copper and aluminum, up to 40-50% of lead are smelted from scrap). For this reason, the location of non-ferrous metallurgy industries is in many cases focused on the resources of secondary raw materials (scrap metal).
In terms of production volume, aluminum smelting (more than 45% of the annual smelting of non-ferrous metals in the world), copper (25%), zinc (16%) and lead (11%) are distinguished. The production of nickel, tin, magnesium, cobalt, tungsten, and molybdenum is significant.
The leading branch of non-ferrous metallurgy (in terms of production and use of products) in the modern world economy is the aluminum industry. Among other branches of non-ferrous metallurgy, this branch is distinguished by the greatest complexity of production. The first stage of aluminum production - the extraction of raw materials (bauxite, nepheline, alunite) - focuses on rich deposits. The second stage - the production of aluminum oxide (alumina) - being material-intensive and heat-intensive, tends, as a rule, to sources of raw materials and fuel. And, finally, the third stage - the electrolysis of aluminum oxide - focuses on sources of cheap electricity (large hydroelectric and thermal power plants).
Most of the raw materials (about 2/3) are processed into alumina locally - in Australia, Brazil, Russia, etc. Part of the raw materials (about 1/3) is exported to countries where aluminum oxide is present main factor- availability of mineral fuel (local or supplied from outside), - USA, Canada, Ukraine, Sardinia (Italy), etc.
The production of metallic aluminum has been predominantly developed in countries with large sources of cheap energy - large hydro resources and powerful hydroelectric power plants (USA, Russia, Canada, Brazil, etc.), rich in natural gas (Iraq, the Netherlands, Great Britain, etc.) or coal(Australia, India, China, etc.). In some old, traditional aluminum smelting centers (France, etc.), where energy is expensive, its production has been greatly reduced and is gradually dwindling.
The largest aluminum producers in the world. The largest exporters of aluminum are Russia, Venezuela, Brazil, Norway, Canada, Australia.
Thus, the aluminum industry is a vivid example of an industry, with a strong territorial gap between the regions of raw materials extraction, production and consumption.
The copper industry in its location is mainly focused on copper resources (natural and secondary raw materials). The low metal content in copper concentrates (from 8 to 35%), the relatively low energy consumption of their processing (in comparison with aluminum smelting) make it profitable to locate copper production (smelting) in places where copper ores are mined and enriched. Therefore, the places of mining and smelting of copper are often geographically combined. The main areas of copper mining are in North and Latin America (Chile, USA, Canada, Peru, Mexico), Africa (, Zaire), CIS (Russia, Kazakhstan), Asia (Japan,), Australia and Oceania (Australia, Papua New Guinea).
The main copper-producing countries are also distinguished in copper smelting, the leading place belongs to the USA, Chile, Japan, and the PRC. The leaders also include Germany, Canada and Russia. Part of the mined ore in the form of concentrates and blister copper is exported to other countries (from Papua and the Philippines to, from Latin America to the USA, from Africa to Europe, from Russia and Kazakhstan to Europe and China). Almost 1/5 of the world's copper smelting is based on scrap metal resources. The copper-smelting industry in Great Britain, France, Germany, Belgium and other countries produces only secondary metal.
The zinc and lead industries usually share a common raw material base- polymetallic ores. Countries with the most large deposits polymetals (USA, Canada, Mexico, Peru in North and Latin America, Ireland and the Federal Republic of Germany in Europe, Russia and Kazakhstan in the CIS, China, Japan, Australia) are also distinguished by their extraction. In terms of lead and zinc smelting, the leading positions in the world are occupied by China, the USA, Canada, Japan, France, Germany, Chile, Italy. Russia is not among the top ten countries in the world production of zinc and lead.
For modern geography The industry is characterized by territorial disunity of places of extraction and enrichment of lead and zinc ores and their metallurgical processing. For example, Ireland, which extracts zinc and lead ores, does not have the capacity to smelt them, while in Japan, the Federal Republic of Germany, and France, the size of metal smelting significantly exceeds the size of zinc and lead production in these countries. Along with the influence of other factors, this is explained by the possibility of using long-distance raw materials, since the transportability of zinc and lead concentrates due to their high metal content (from 30 to 70%) is extremely high.
Placement of the tin industry. Most (about 2/3) of the production and smelting of tin is provided by the countries of Southeast Asia, and above all, as well as Indonesia and. Brazil, Australia, Russia, and China also have large volumes of tin mining and smelting.
In the world production of zinc, lead and tin, as well as in the copper industry, the share of secondary raw materials (scrap metal) is high. This is especially typical for non-ferrous metallurgy in developed countries, where secondary raw materials provide 50% of lead smelting, 25% of zinc and tin.
The world's largest gold producers are South Africa (450 tons), USA (350), Australia (300 tons), Canada (170 tons), China (160 tons), Russia (130 tons).
The global iron ore market in the 2000s was one of the fastest growing commodity markets in both physical and value terms. In the crisis year of 2009, the world trade in iron ore, in contrast to most goods, maintained its progressive development, the growth continued in 2010. In value terms, the market volume in 2009 decreased due to a strong decline in prices, but in 2010 it significantly exceeded pre-crisis indicators.
World trade in iron ore in 2010 in physical terms increased by 13% (in 2009 - by 5.5%), and in value terms - by about 80% (in 2009 it decreased by 17%). The physical volume of world trade in iron ore in 2010 exceeded 1.1 billion tons, and the value (for export) 105 billion dollars.
The growth in trade in 2009 was facilitated by the sharply increased demand from the PRC, which overlapped its decline from other leading buyers - the EU, Japan, the Republic of Korea, etc.
In 2010, Chinese demand remained stable, while in the rest of the iron ore importing countries, the recovery of metallurgical production led to a significant increase in purchases on the world market.
The largest exporter of iron ore in recent years is Australia, whose supplies have been growing continuously since 2002. In 2010, its exports amounted to 403 million tons, which is 11% higher than in 2009. In the 2000s, Australian exports began to be almost entirely directed to East Asia, while supplies to Europe decreased to an insignificant value, and shipments to the Middle East and North America stopped. China has been the main buyer of Australian iron ore since the middle of the first decade of the new century; in 2010, it accounted for 68% of exports. The share of Japan in 2010 was 19%, the Republic of Korea - 9.5%, Taiwan - 3%, EU countries - 0.5%.
The second place in the export of iron ore is taken by Brazil, which was the leader along with Australia until 2007. In 2010, after the decline in the previous year, Brazilian supplies increased by 17% and reached a new all-time high of -311 million tons. Brazil's exports are traditionally characterized by broad geographic diversification through high quality ores and more profitable geographic location compared to major competitors. It is this country that should be considered the most competitive supplier of iron ore on a global scale.
The main market for Brazilian iron ore raw materials in the 2000s was East Asia, ahead of Europe. In addition, exports to the Middle East are significant, in Latin America, NAFTA countries, North Africa, Southeast Asia. China became the largest importer of iron ore from Brazil at the beginning of the new century - in 2010 its share was 49%. Other major buyers in 2010 were Japan (12%), Germany (about 7%), Republic of Korea (about 4%), Argentina, Great Britain, Italy, France (2.5% each), the Netherlands (more than 2%) , Bahrain, Saudi Arabia (2% each), Taiwan (1.5%).
India is the third largest exporter of iron ore. In the first half of the 2000s, its supplies grew rapidly, but then the pace slowed down, which was associated with a significant increase in domestic consumption, which resulted in more high prices on Indian ore compared to major competitors; and export restrictions periodically imposed by Indian authorities. In 2010, deliveries from India decreased by 9% compared to the previous year, amounting to 104 million tons. Since the mid-2000s, China has become the dominant export destination for India, and in 2010 its share was 93%. Japan remained a major buyer (in 2010 - 5%). In 2010, significant deliveries were also made to the Republic of Korea and the EU countries.
South Africa sharply increased supplies of iron ore in 2009, thus consolidating its fourth position in the list of the leading exporters of this raw material. In 2010, its exports grew by almost 8%, reaching a new maximum of 48.5 million tons. East Asia remained the main sales market, with the EU countries still of great importance. The largest buyer of iron ore from South Africa was the PRC, whose share in 2010 was 63%. Germany and Japan were also major importers (12.5% each). Significant shipments were made to such states as (%): DPRK (4), Italy (2.5), Great Britain (about 2), Slovenia (1.5), Republic of Korea (1).
Ukraine, after a rather long period of export stagnation, has been dynamically increasing supplies of iron ore since 2008. In 2010, its exports grew by 18.5%, amounting to a record 32.7 million tons. -s made large-scale sea shipments to China profitable. In recent years, it was the PRC that was the leading importer of Ukrainian iron ore, and in 2010 its share was 39%. Major buyers remained (%): Poland (14), Czech Republic (13), Austria (11) and Slovakia (9). Other export destinations in 2010 were Serbia (5.5), Romania (3), Turkey (2.5) and Hungary (2).
Exports of iron ore from Canada in 2010 increased by 4.5% and amounted to 32.6 million tons, which was the highest figure since 1998. The main markets for it in recent years have been Western Europe (traditional) and East Asia ( new), while the value of the United States has greatly decreased. The largest volume of supplies in 2010 was made to Germany and China (22% each), as well as (%): to the USA (13.5), France (11), Trinidad and Tobago (5.5), Great Britain (3 , 5), Belgium (3), Japan (2.5), Taiwan (about 2.5), Italy, the Republic of Korea (2% each).
Russia in 2010 increased its export of iron ore by 11% - to 22.8 million tons (including trade within the Customs Union), which is significantly lower than the maximum in 2007. Traditionally, Russian ore was supplied mainly to Eastern European states, as well as to Finland and Ukraine, occasionally large deliveries were made to Western Europe and Turkey, since the mid-2000s, significant shipments were made towards China. The main counterparties of iron ore exports from Russia in 2010 were such states as (%): China (32), Slovakia (12), Ukraine (11.5), Netherlands (11), Italy, Czech Republic (6 each), as well as Kazakhstan (4.5), Hungary (4), Poland (3.5), the United States and Turkey (2.5 each).
Exports of iron ore from Sweden in 2010 increased by 29% and reached their maximum over the past 30 years at 20.7 million tons. deliveries were made to North Africa and the Middle East. In 2010, the largest volumes of exports were directed to Germany (25%), as well as (%): to Finland (18), Saudi Arabia (14), the Netherlands (10), Turkey (8), China (7), Egypt (5), Great Britain (4), Qatar (3), Libya (more than 2) and Hungary (about 2%).
Kazakhstan in 2010 increased its export of iron ore by 12.5% - to about 16.5 million tons (including trade within the Customs Union), significantly surpassing the maximum in 2006-2007. For a long time, the overwhelming part of supplies from Kazakhstan was sent to Russia within the framework of the formed back in the 1960s. technological links with metallurgical plants Urals, primarily the Magnitogorsk Combine. In the 2000s, a significant increase in demand in neighboring China made supplies to this country attractive. In 2010, Russia accounted for 62% of Kazakhstan's iron ore exports, and China for 37%.
Iranian iron ore exports doubled in 2010, reaching 15 million tons. Thanks to this, the country entered the top ten for the first time largest exporters... The vast majority of Iran's exports (over 95%) went to China.
Chile showed strong growth in iron ore exports for the second year in a row; in 2010, it increased by 27% to a maximum level over the past 30 years of 10.7 million tons, while the main direction of supplies was the PRC (in 2010 - 73%). Other important destinations were (%): Japan (12), Indonesia (7) and Malaysia (4).
The supply of iron ore from Mauritania to the world market in the first decade of the new century was quite stable. In 2010, they remained at the level of the previous year, amounting to 10.5 million tons, which is slightly below the maximum indicators of previous years. The export of Mauritania has traditionally been directed mainly to the Western European market, however, during the crisis, the importance of the Chinese market has grown sharply. In 2010, the share of China was 40%, France -18%, Italy - 13%, the Netherlands -10%, Belgium, Germany, Spain - 4-5% each.
The USA exported 10 million tons of iron ore in 2010, increasing shipments 2.6 times compared to the previous year. Historically, the overwhelming majority of American supplies were directed to Canada (81%), from other countries of destination, China (7%), Germany (3.5%), France (2.5%) and Mexico (2%) can be distinguished.
The export of iron ore by Indonesia in 2010 increased by 1.5 times, reaching a record 8.7 million tons. Almost all goods were supplied to the Chinese market, the share of other countries was about 1%.
Iron ore supplies from Peru in 2010 increased 21% to 8.2 million tons, which became a new record for the country. Almost 95% of exports were directed to the PRC, about 4% to Japan.
Venezuela exported 7.5 million tons of iron ore in 2010, almost 2 times more than a year earlier. The largest volumes of deliveries were made to China (70%), Belgium (15%), France (7%) and the USA (3.5%).
Since 2003, the PRC has been the world's largest importer of iron ore, ahead of the previous leader, Japan. In the 2000s, it was the explosive growth of Chinese demand that became the main reason for the sustained expansion of international iron ore trade. The PRC's share in world imports has quadrupled over the past 10 years, amounting to more than 55% in 2010 (in the crisis year of 2009, against the background of low demand in other countries, this figure was about 65%).
The rapid growth in demand from the PRC led to a significant increase in the cost of iron ore, which stimulated the development of export-oriented mining in many countries of the world, including those that had not previously exported or even mined iron ore (Iran, Indonesia, Mongolia, Myanmar, Thailand and etc.). Of the approximately 50 countries currently engaged in competitive export of iron ore (i.e., excluding resale, practiced primarily by a number of European importers within the EU), only Bosnia and Herzegovina and Albania do not supply their goods to the PRC. At the same time, out of the 20 leading exporters of iron ore, only four (Sweden, Kazakhstan, the United States and the Philippines) have China as their largest buyer.
China's iron ore imports in 2010 for the first time in 10 years of the new century decreased by 1.5% - to 619 million tons, however, the analysis of monthly data on purchases does not give grounds to conclude that the trend is breaking, and by the end of 2011 it is more likely imports seem to be increasing rather than decreasing. The main suppliers of iron ore to the PRC were Australia, Brazil and India, which together provide 80-85% of Chinese imports; in 2010, their shares were 43%, 21% and 15.5%, respectively. South Africa (about 5%), Iran (about 2.5%), Ukraine (2%), Indonesia, Peru, Chile, Russia, Kazakhstan (about 1% each), Venezuela (about 1 %). In total, in 2010, the PRC imported more than 1 million tons of iron ore from 23 countries.
The total imports of iron ore by the EU countries in 2010 amounted to 165 million tons, which is almost 1.5 times more than in 2009, but significantly lower than the pre-crisis indicators. Of this volume, more than 125 million tons were imported from outside the region, and 25 million tons were re-exported by the Netherlands (mainly to Germany), about 15 million tons were other intraregional trade (mainly supplies from Sweden) ... Brazil has traditionally been the leading supplier of iron ore to the EU; in 2010, its share was 50%. Important EU import partners were countries such as (%): Ukraine (15), Canada (13), Russia (7.5), South Africa (5), Mauritania (4.5), as well as Venezuela (2), Australia (about 1.5) and Norway (over 1).
In 2010, Germany has traditionally been the largest importer among the EU countries (43 million tons), the second place belongs to the Netherlands (34 million tons), thanks to re-export operations. Outstanding among the rest of the EU countries (million tons): France (15.3), Italy (12.1), Great Britain (10.6), Austria (8), Belgium (7.6) and Poland (6.5) ... The geographic structure of imports of individual countries was characterized by similar features: for the Eastern European states, the main partners were Ukraine and Russia, for the rest of the countries - Brazil, Canada, Sweden, South Africa, Mauritania.
Japan's imports of iron ore in 2010 increased by 27% after falling by 25% in the previous year, but remained below the pre-crisis indicators, amounting to 134 million tons. the place was occupied by Brazil (30%). South Africa (4.5%) and India (4%) were quite large suppliers.
The Republic of Korea retained its position as the third largest iron ore importing country, ahead of Germany. In 2010, it increased imports by a record 34% or more than 14 million tons, reaching a new all-time high of 56.3 million tons.Australia (69%) has traditionally been its main supplier, followed by Brazil (23 %). In 2010, purchases were made in significant volumes in South Africa (4.5%), India (1.5%) and Canada (1%).
Taiwan's imports of iron ore in 2010 increased by almost 60% to 18.9 million tons, which was a new all-time high. Almost all imports came from Australia (67%) and Brazil (27%); significant purchases are regularly carried out in Canada (in 2010 - 5%).
In 2010, Russia increased imports of iron ore by 18% - up to 10.5 million tons (including trade within the Customs Union), which was significantly lower than the pre-crisis indicators. In the new century, almost all ore was traditionally imported from Kazakhstan, up to 2% in some years was imported from Ukraine.
Iron ore imports Saudi Arabia in 2010, it grew by 55% - to 8.2 million tons, which was the second result in its history after the maximum in 2005. The largest volumes of iron ore were imported from Brazil (about 65%) and Sweden (30%).
Canada in 2010 increased the import of iron ore 2.6 times - up to 8.1 million tons, which is significantly lower than the pre-crisis maximum. Almost the entire volume is historically imported from the United States.
Argentina's iron ore imports in 2010 increased 2.2 times, reaching a record 7.7 million tons. Traditionally, purchases are almost entirely carried out in Brazil.
Turkey in 2010 became one of the few buyers that reduced the import of iron ore by 7.5% compared to the same indicator in 2009, while imports amounted to 7.2 million tons. The main suppliers to the Turkish market in 2010 were Brazil (48%), Sweden (26%), Ukraine (12%) and Russia (9%).
Purchases of US iron ore in 2010 increased by 64% - to 6.4 million tons, which is significantly less than the previous figures; the largest part of import demand was traditionally provided by Canada (70%). In that year, Russia (9.5%), Brazil (8%) and Venezuela (4%) also had a significant weight.
The material was prepared by A.V. Khokhlov